Plot Options are PCX features which adjust the display settings to tailor-fit the designer's requirements. They aid in distinguishing between points, decluttering the display, and reducing the complexity of the visualisation.
Graph Options: Defining the basic settings of the plotted datapoint lines (popup window).
- Point Type: Choose the symbol displayed on the axis (None, Star, Circle, Cross, Square).
- Point SIze
- Line Thickness
- Display Datapoint Values: Show the numeric values of the datapoints in focus on the main PC plot.
Show Intersection/Sum of Selections: Choose whether to display only the datapoints which are included in all selections (intersection - default) or points which are in at least one selection (sum).
Show/Hide Points: Enable/Disable excluded datapoints from being displayed on the main PC plot and Scatter Plots.
Clear All Selections: Remove all interval and scatter plot selections.
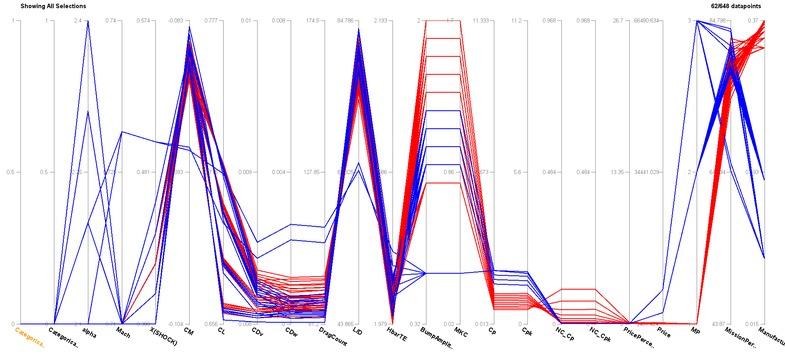
Show All Selections: Display overlaid sets of selections. Choose which sets of selections to display in the "Show/Hide Selections" popup window.
Move Axis Left/Right: Switch the position of the axis in the plot.
Add Axis: Insert a new axis with variable values calculated from designer-input mathematical expressions.
Show/Hide Axes: Choose which axes to display from the dataset (popup window).
Delete Axes: Permanently delete selected axes.