Using ASM for critical path analysis
Critical Path Analysis helps to analyse the dependencies in a non-iterative project to determine which tasks are on the critical path. Any delay to a task on the critical path will propagate to the end of the project. Conversely, a delay to a task not on the critical path can be absorbed (within certain limits that are determined by the project structure).
Thus, critical path analysis can help managers to understand which tasks in a project can be allowed to slip, and thus focus effort on the most important tasks.
CAM allows critical path to be calculated for task networks with uncertain duration, as explained below.
How to set up a Critical Path Analysis using the ASM toolbox
The example below can be downloaded here: CriticalPathExample.cam
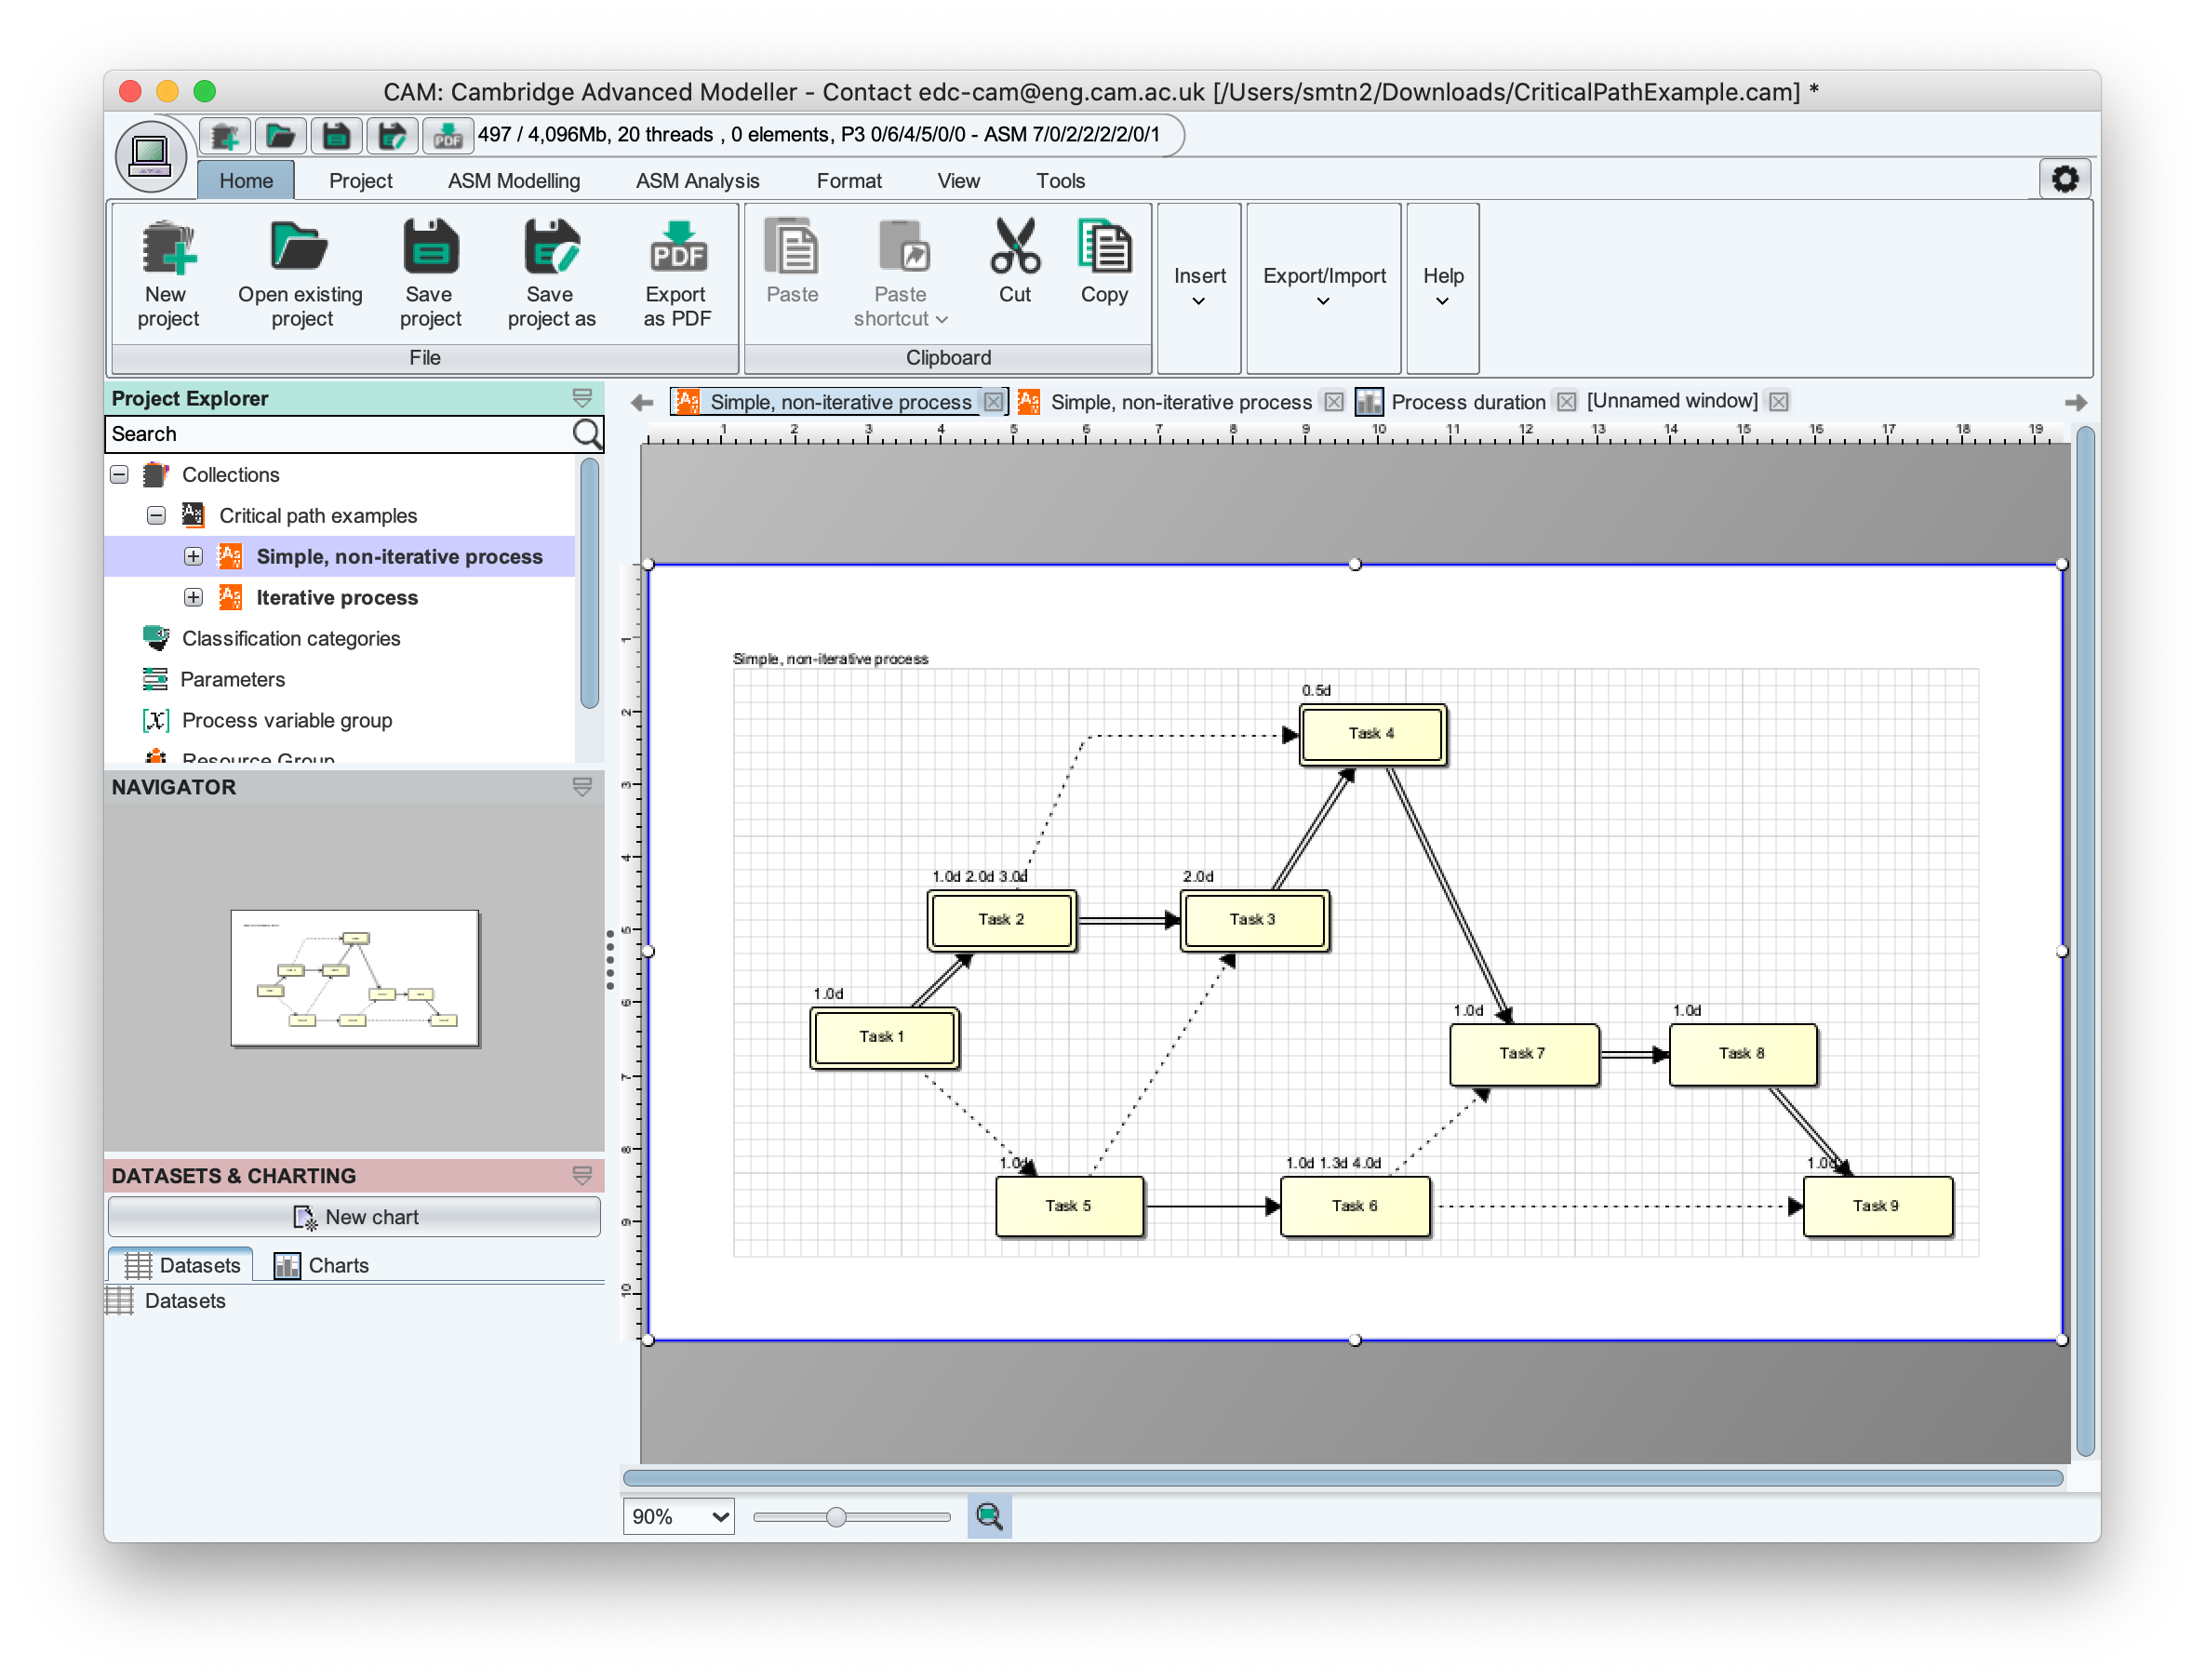
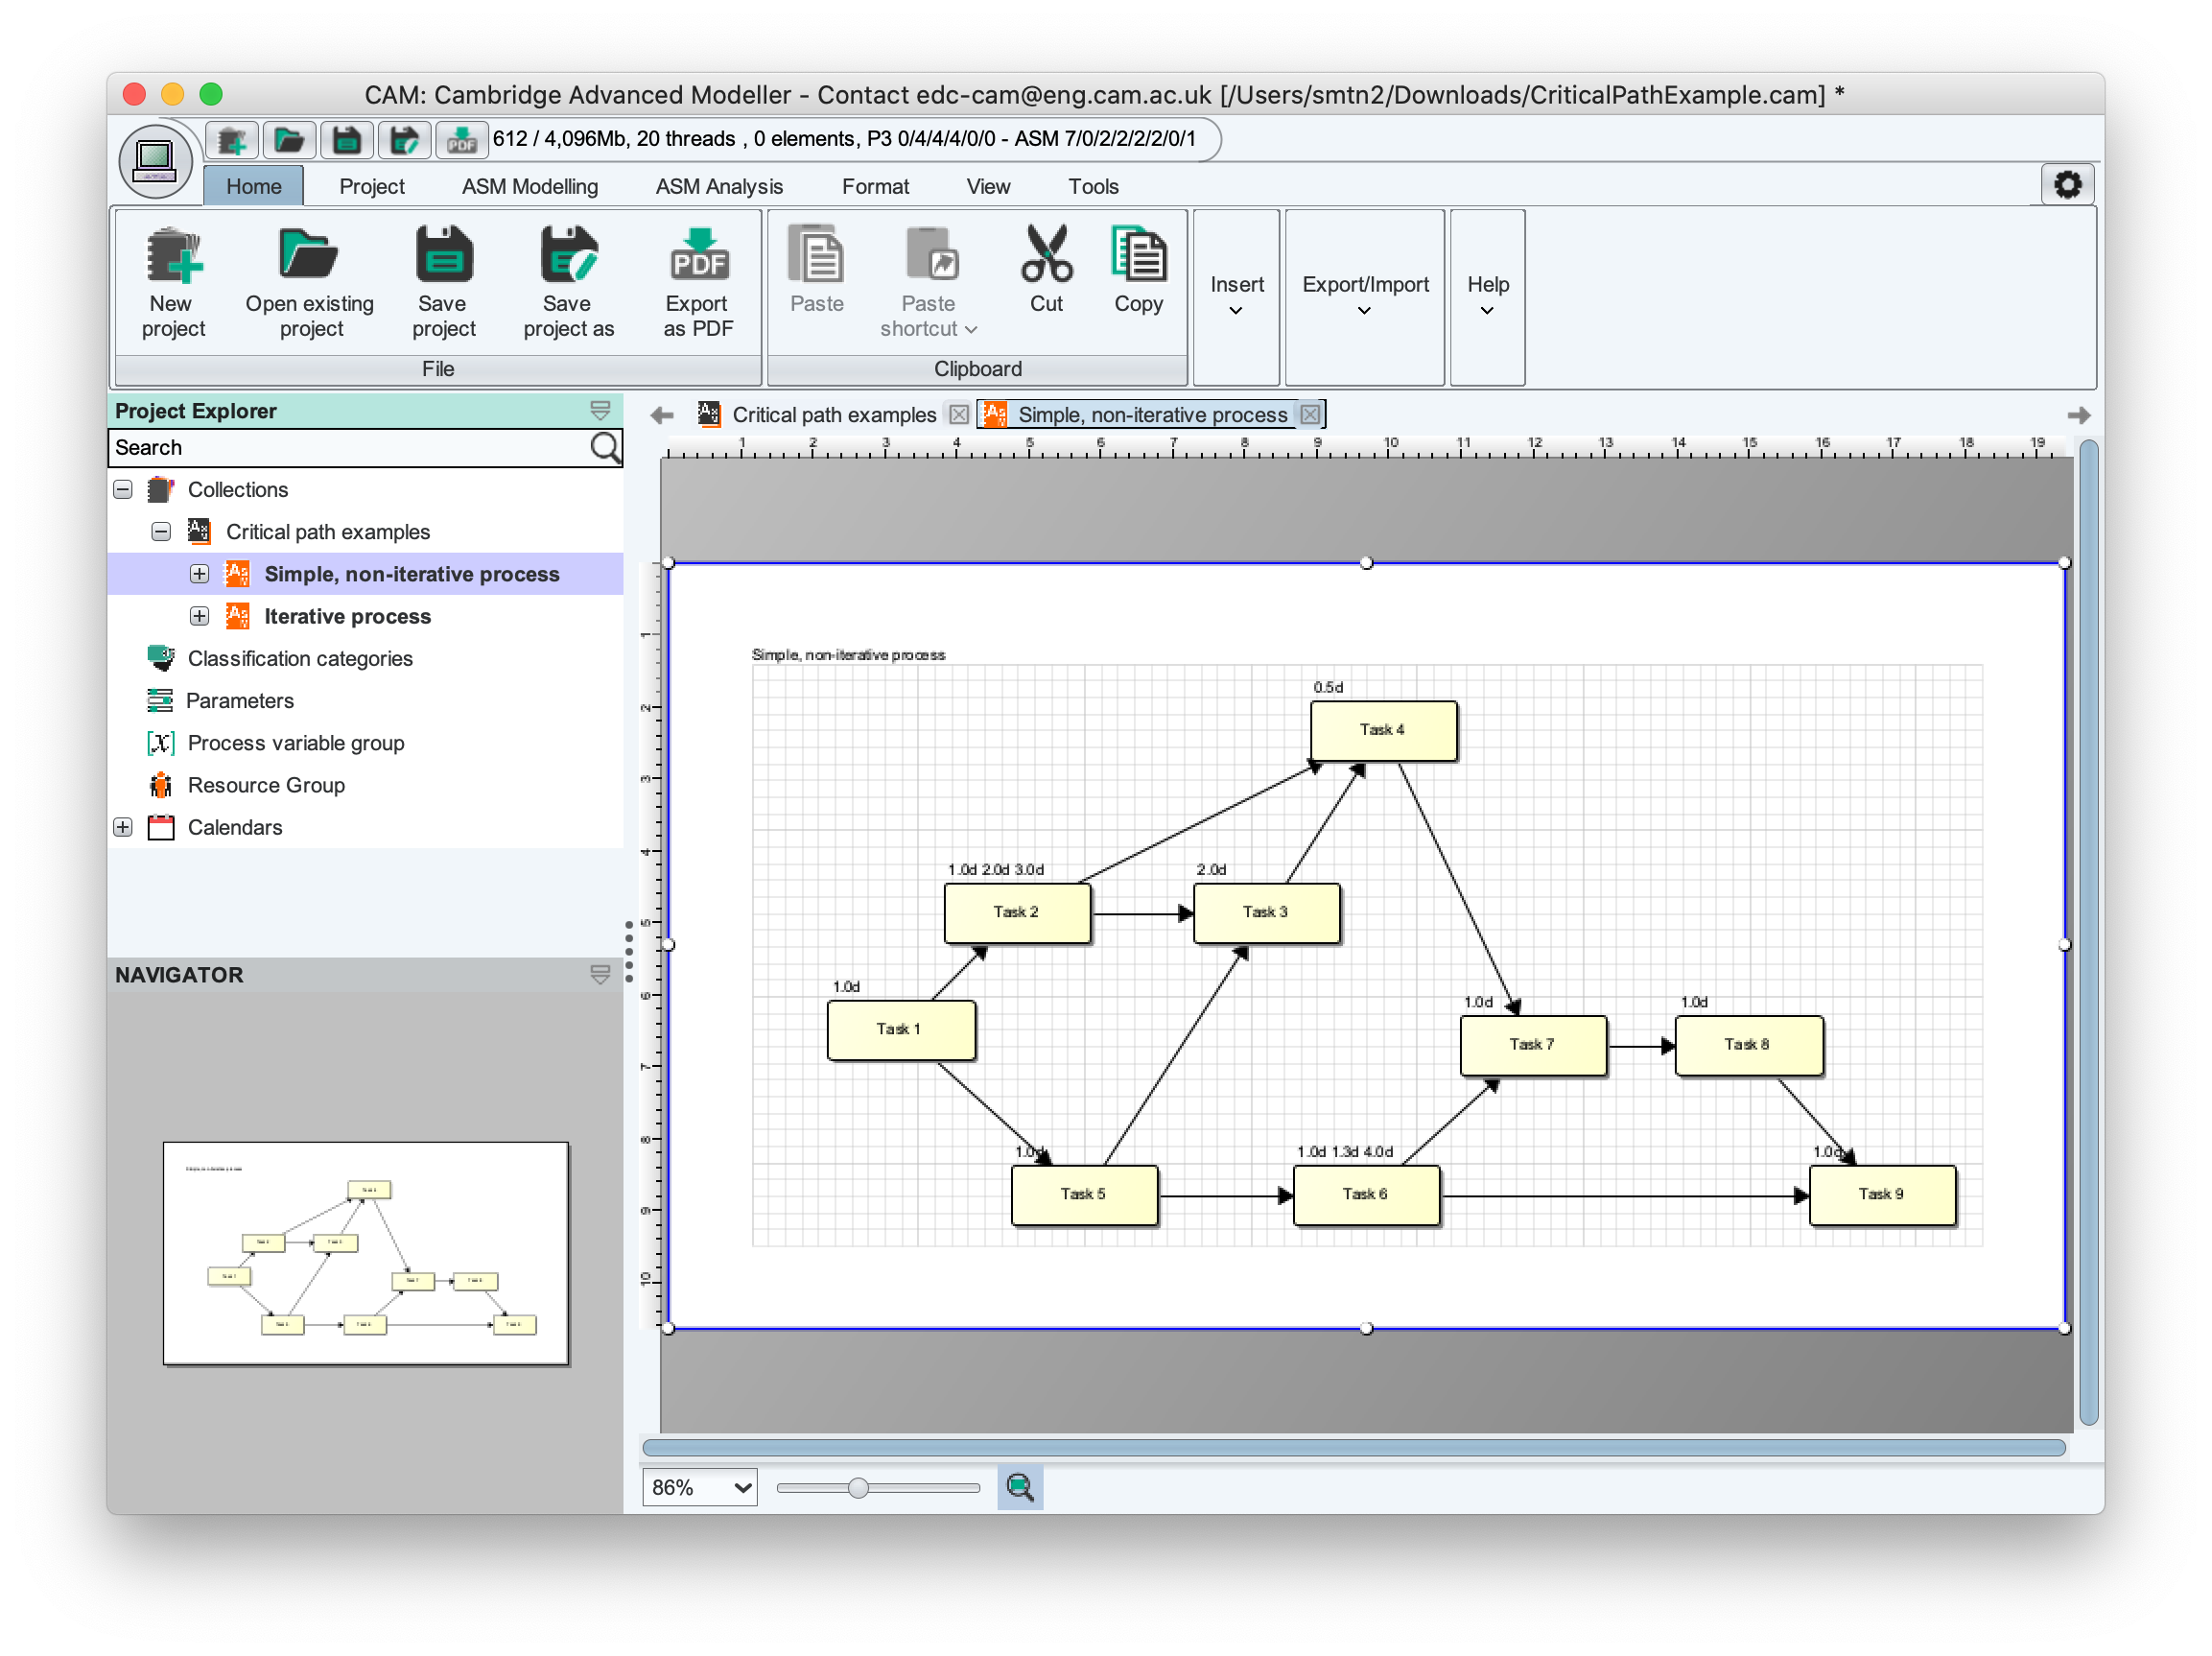
The first step in a critical path analysis (CPA) is to model the tasks and their dependencies using the ASM toolbox. An illustrative project network is shown below. Each task has a duration, which may be exact or may be specified using a probability distribution (this is configured by double-clicking each task, selecting the 'behaviour' tab at the side of the dialog, then using the options on the 'duration' subpane). It is important that no iteration constructs are included, and that the network contains no cycles.


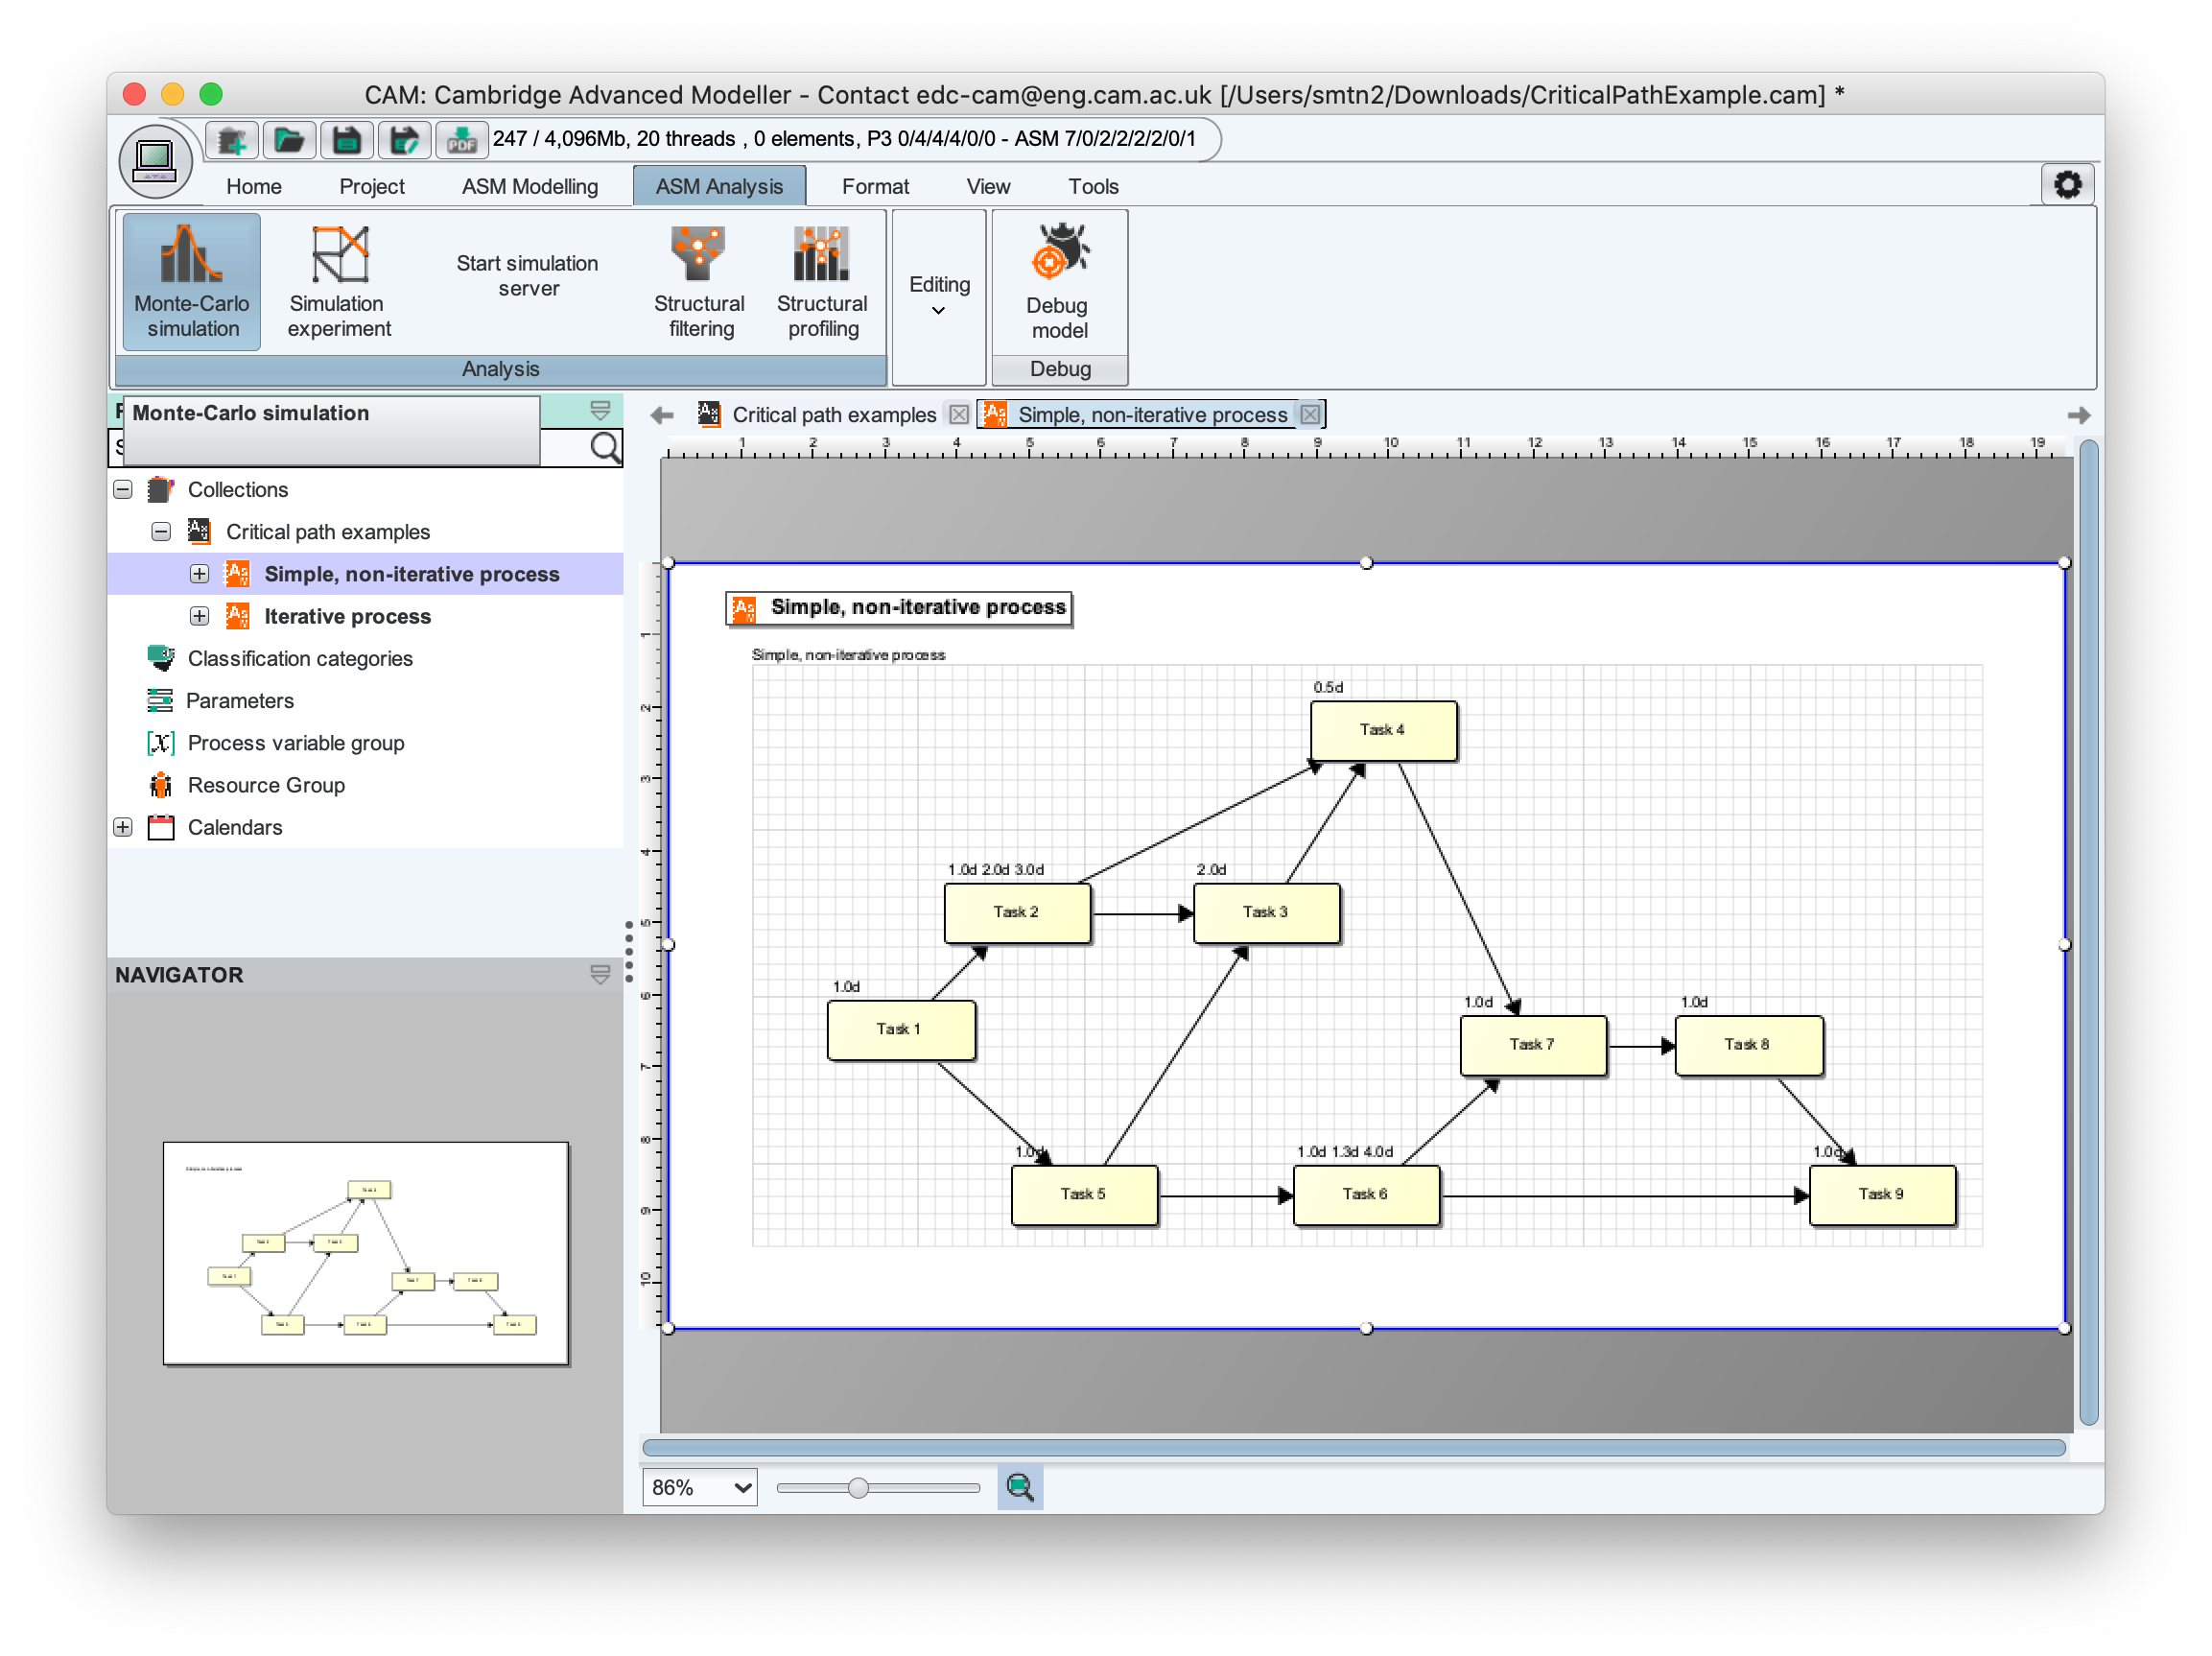
Having specified the project network and set up the duration of each task, start a simulation using the Analysis->Monte-Carlo simulation menu item. We can choose any number of simulation runs, usually about 1000 is sufficient.

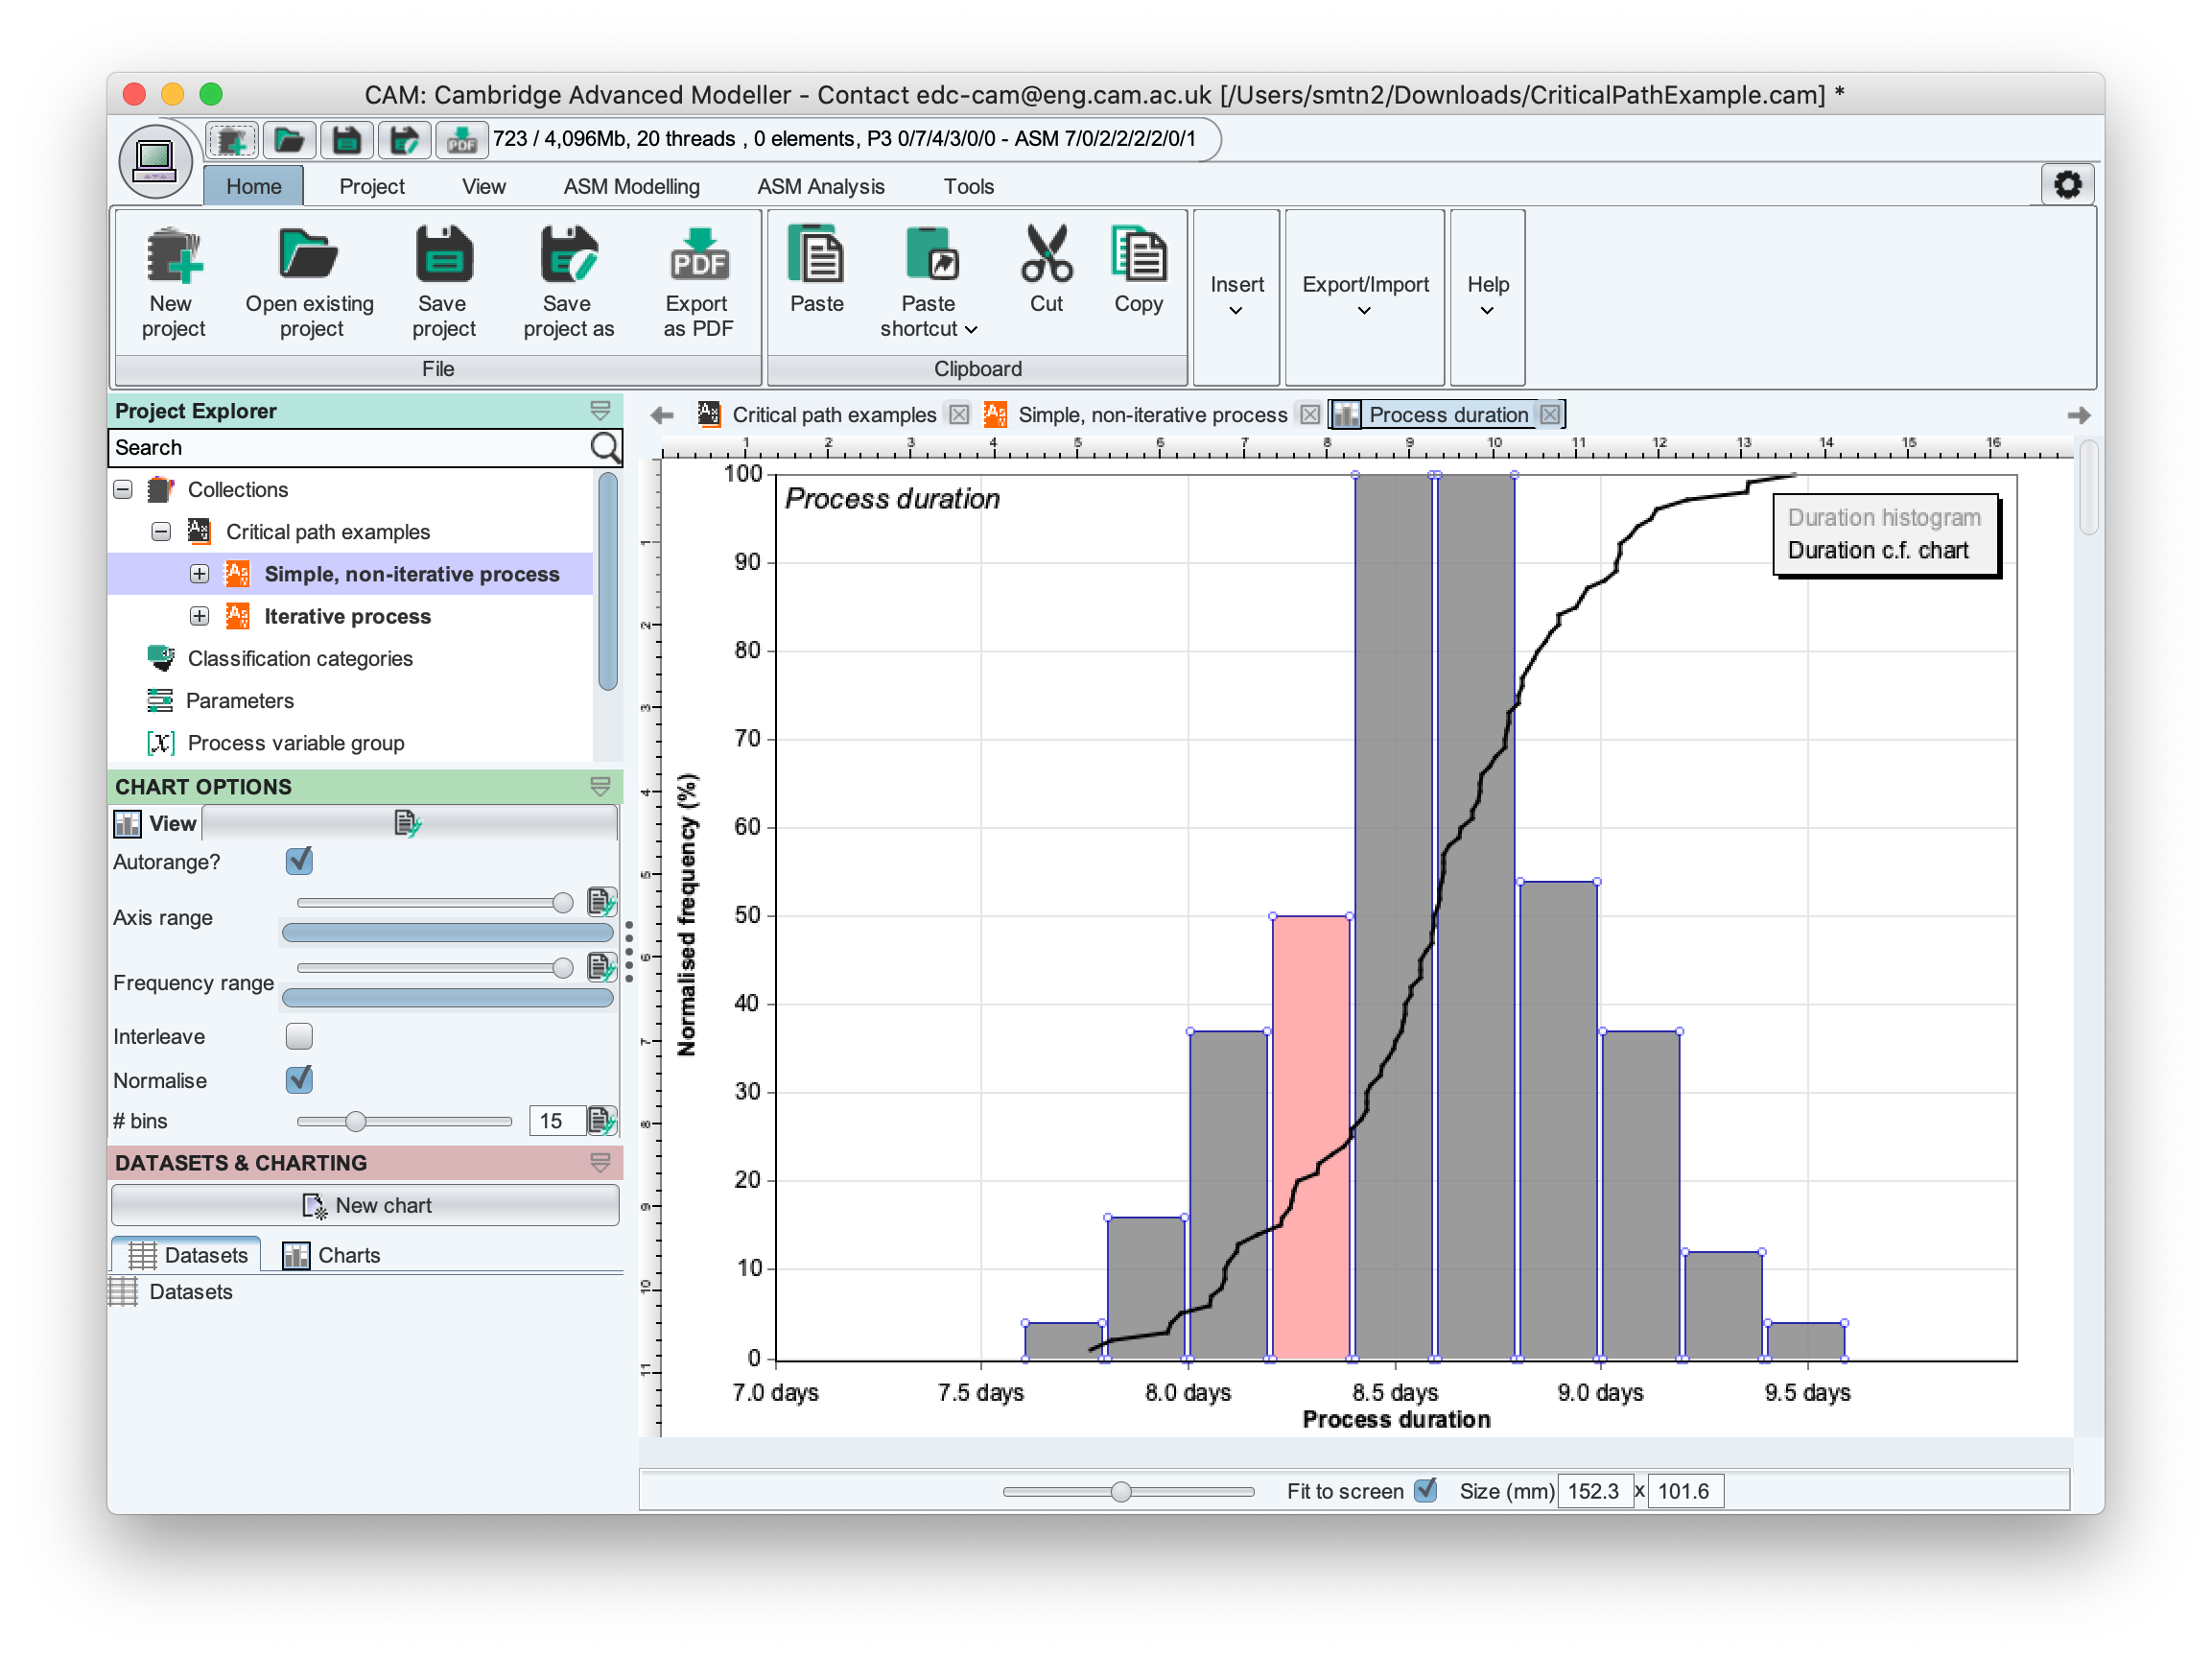
The simulation results are shown as a histogram, which illustrates the spread of outcomes for the project. The same data is shown as a cumulative frequency plot overlaid on the histogram. Depending on the duration of each task on each simulation run, a different outcome will result. The most likely outcome is shown at the 'peak' of the histogram.
To view the actual processes which are 'most likely', hover over the histogram bar showing the peak and right-click using the mouse. This will bring up a pop-up menu; select 'View processes' to explore the different process outcomes contained in that histogram bin. This will bring up a screen from which you can see the individual processes on the "DATA POINTS" tab on the left-hand side. Exploring the different outcomes by selecting with the mouse will show that a different pattern of task durations will occur each time. The processes shown are only those that were contained within the histogram bin originally selected (ie, those which had total duration within the minimum and maximum bounds of the selected histogram bar, as shown on the horizontal axis of the histogram plot)
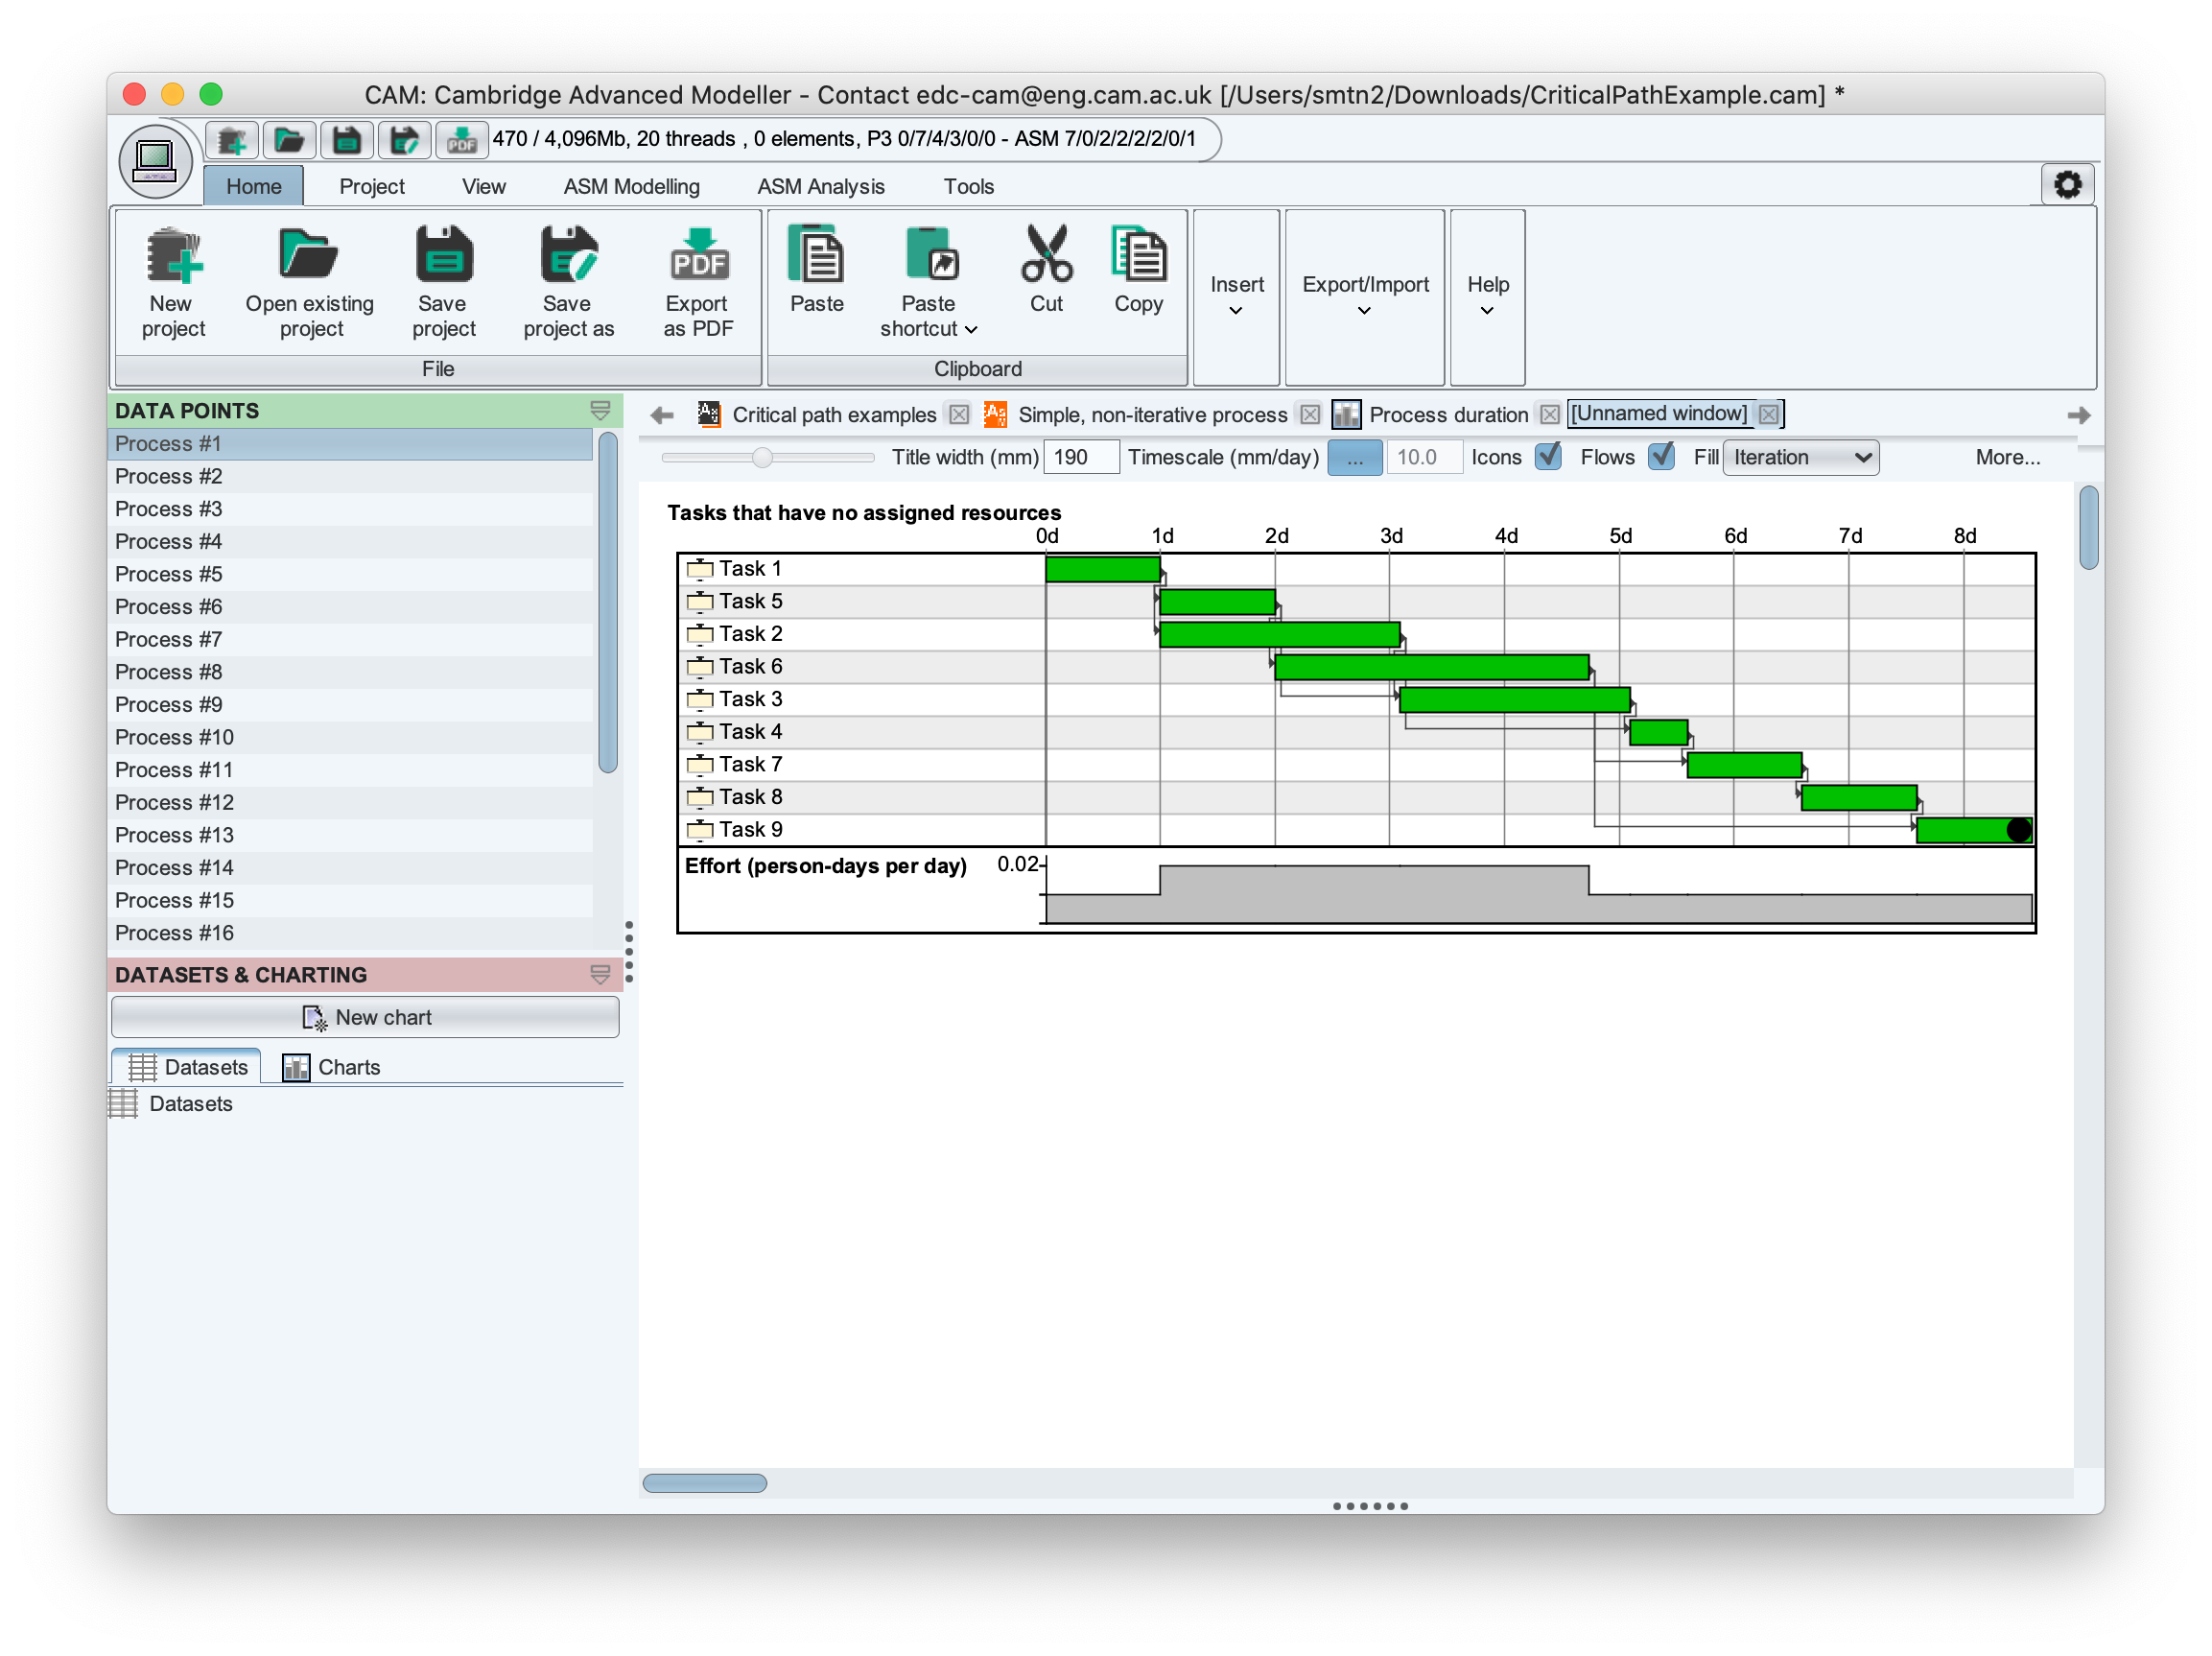
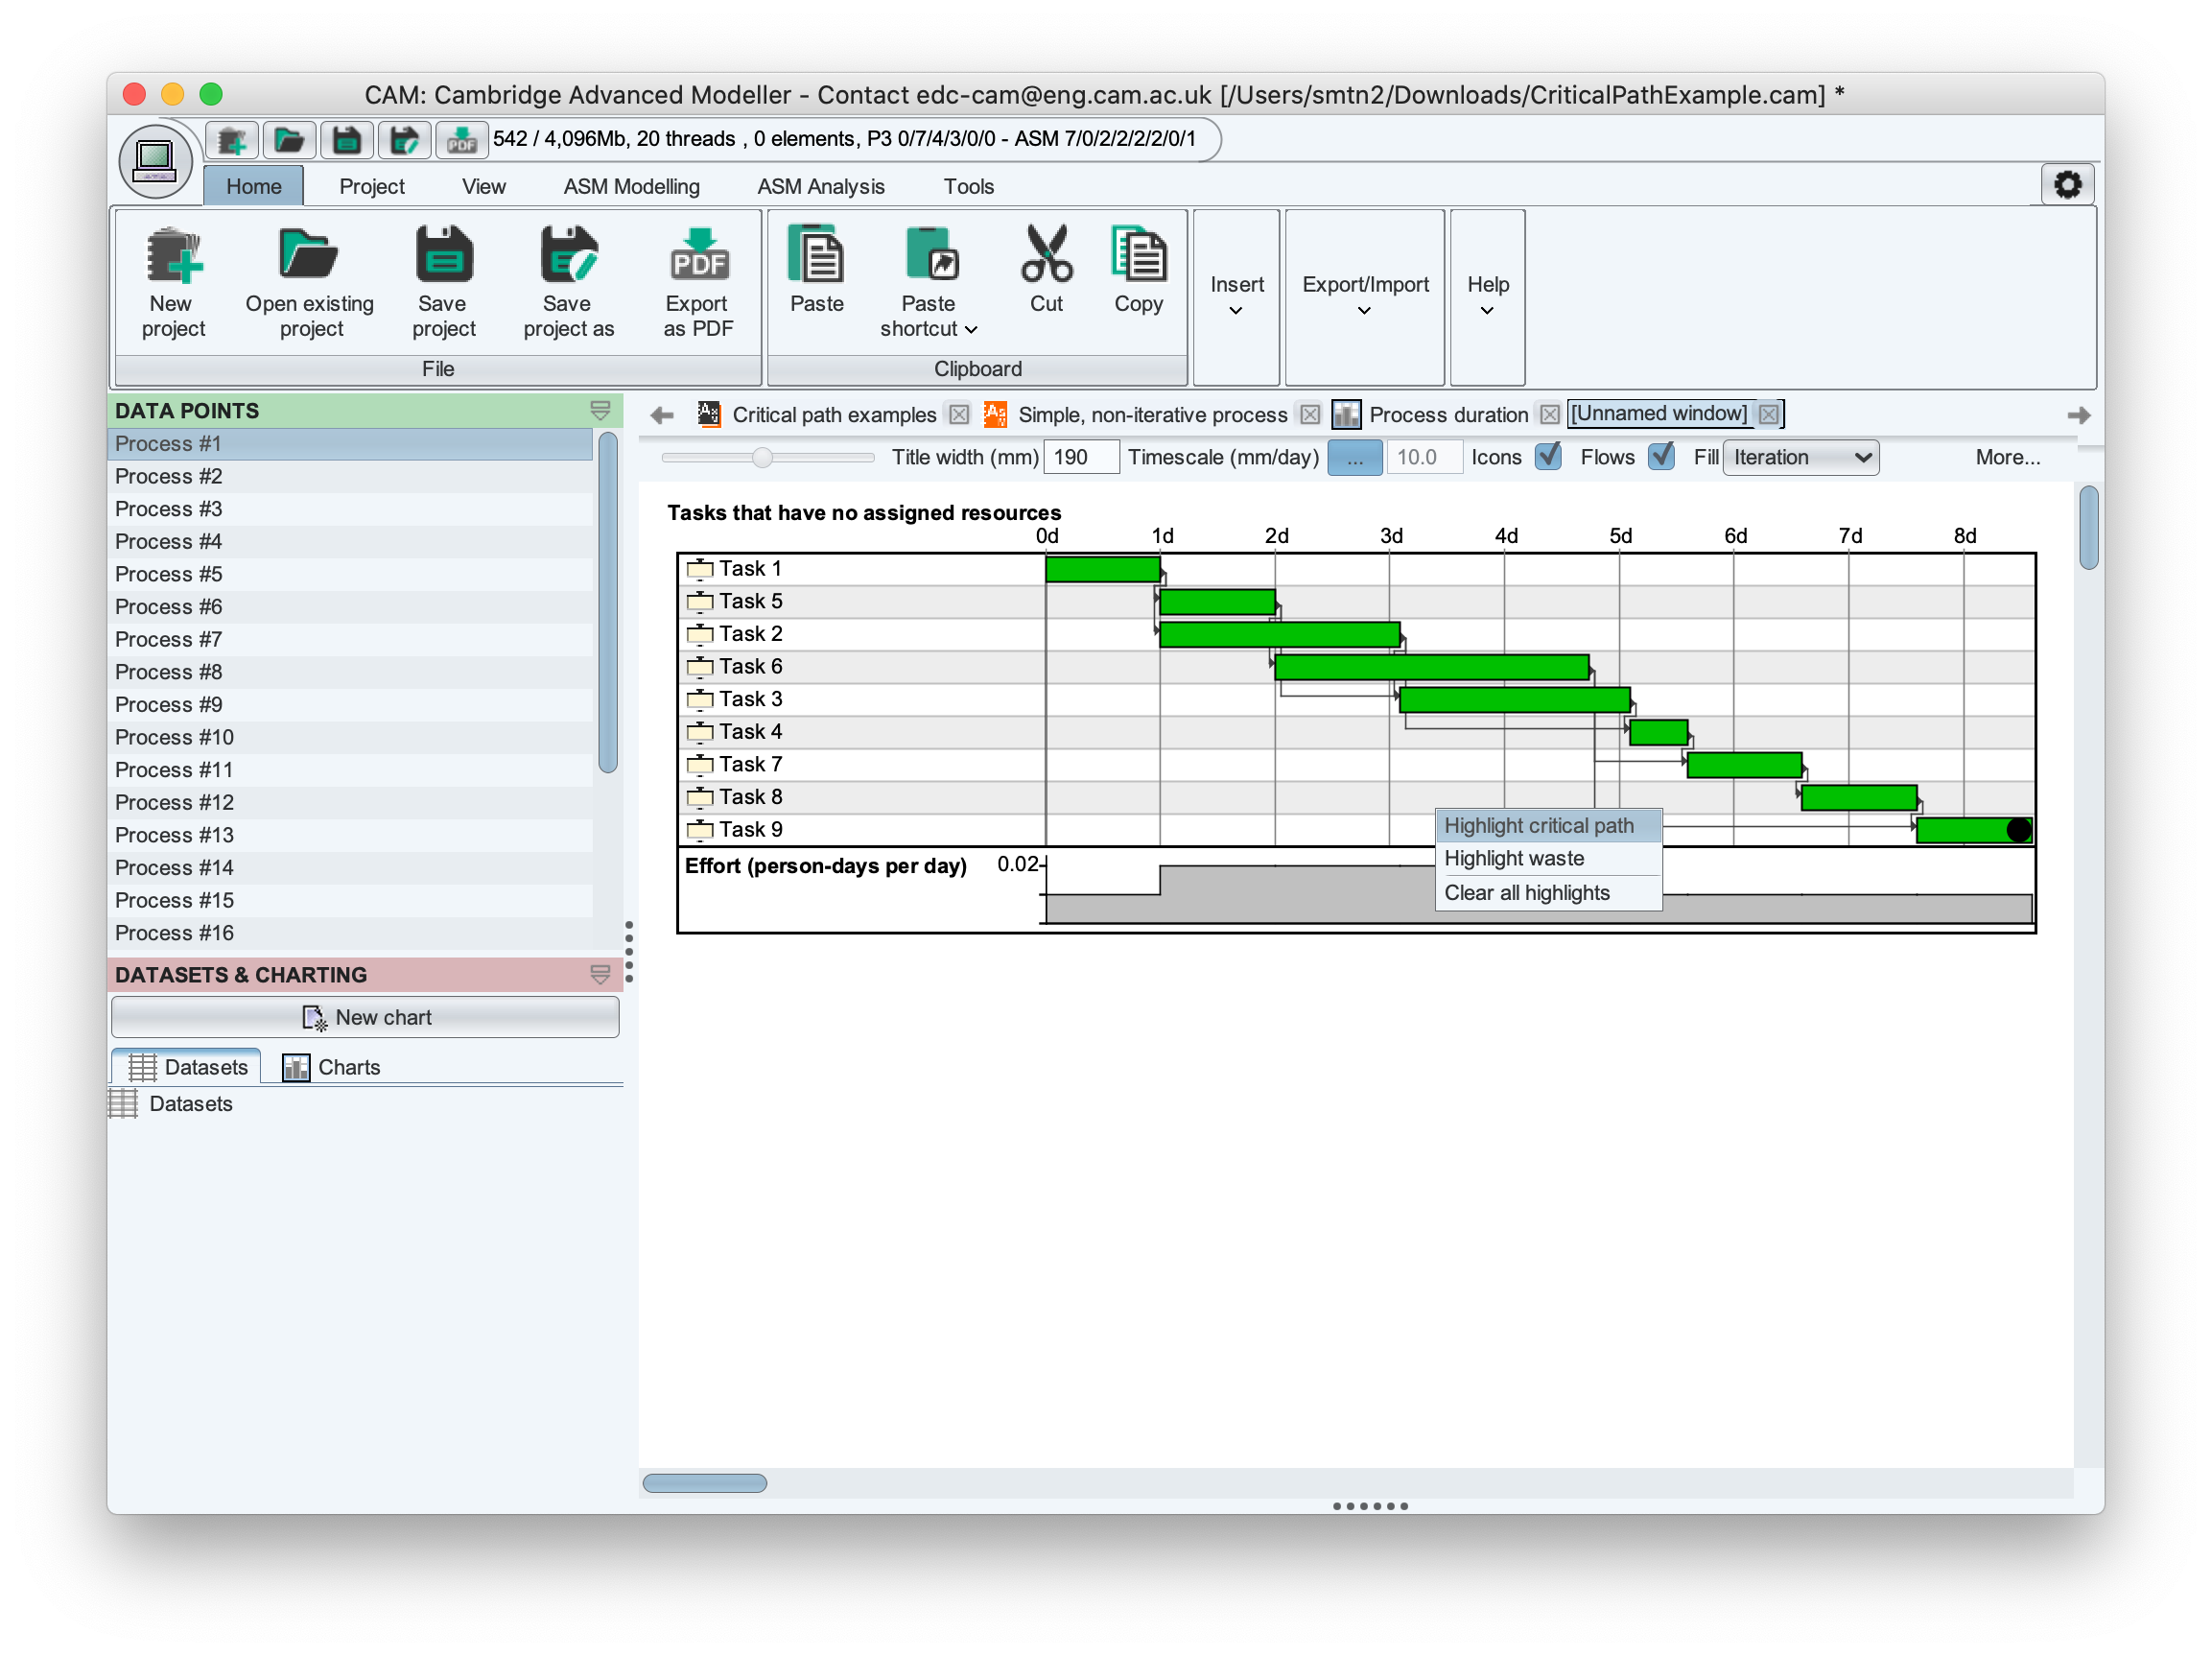
To calculate the critical path for any given process outcome, right-click the Gantt-chart background to access a popup menu, then select "Highlight critical path", as shown below:
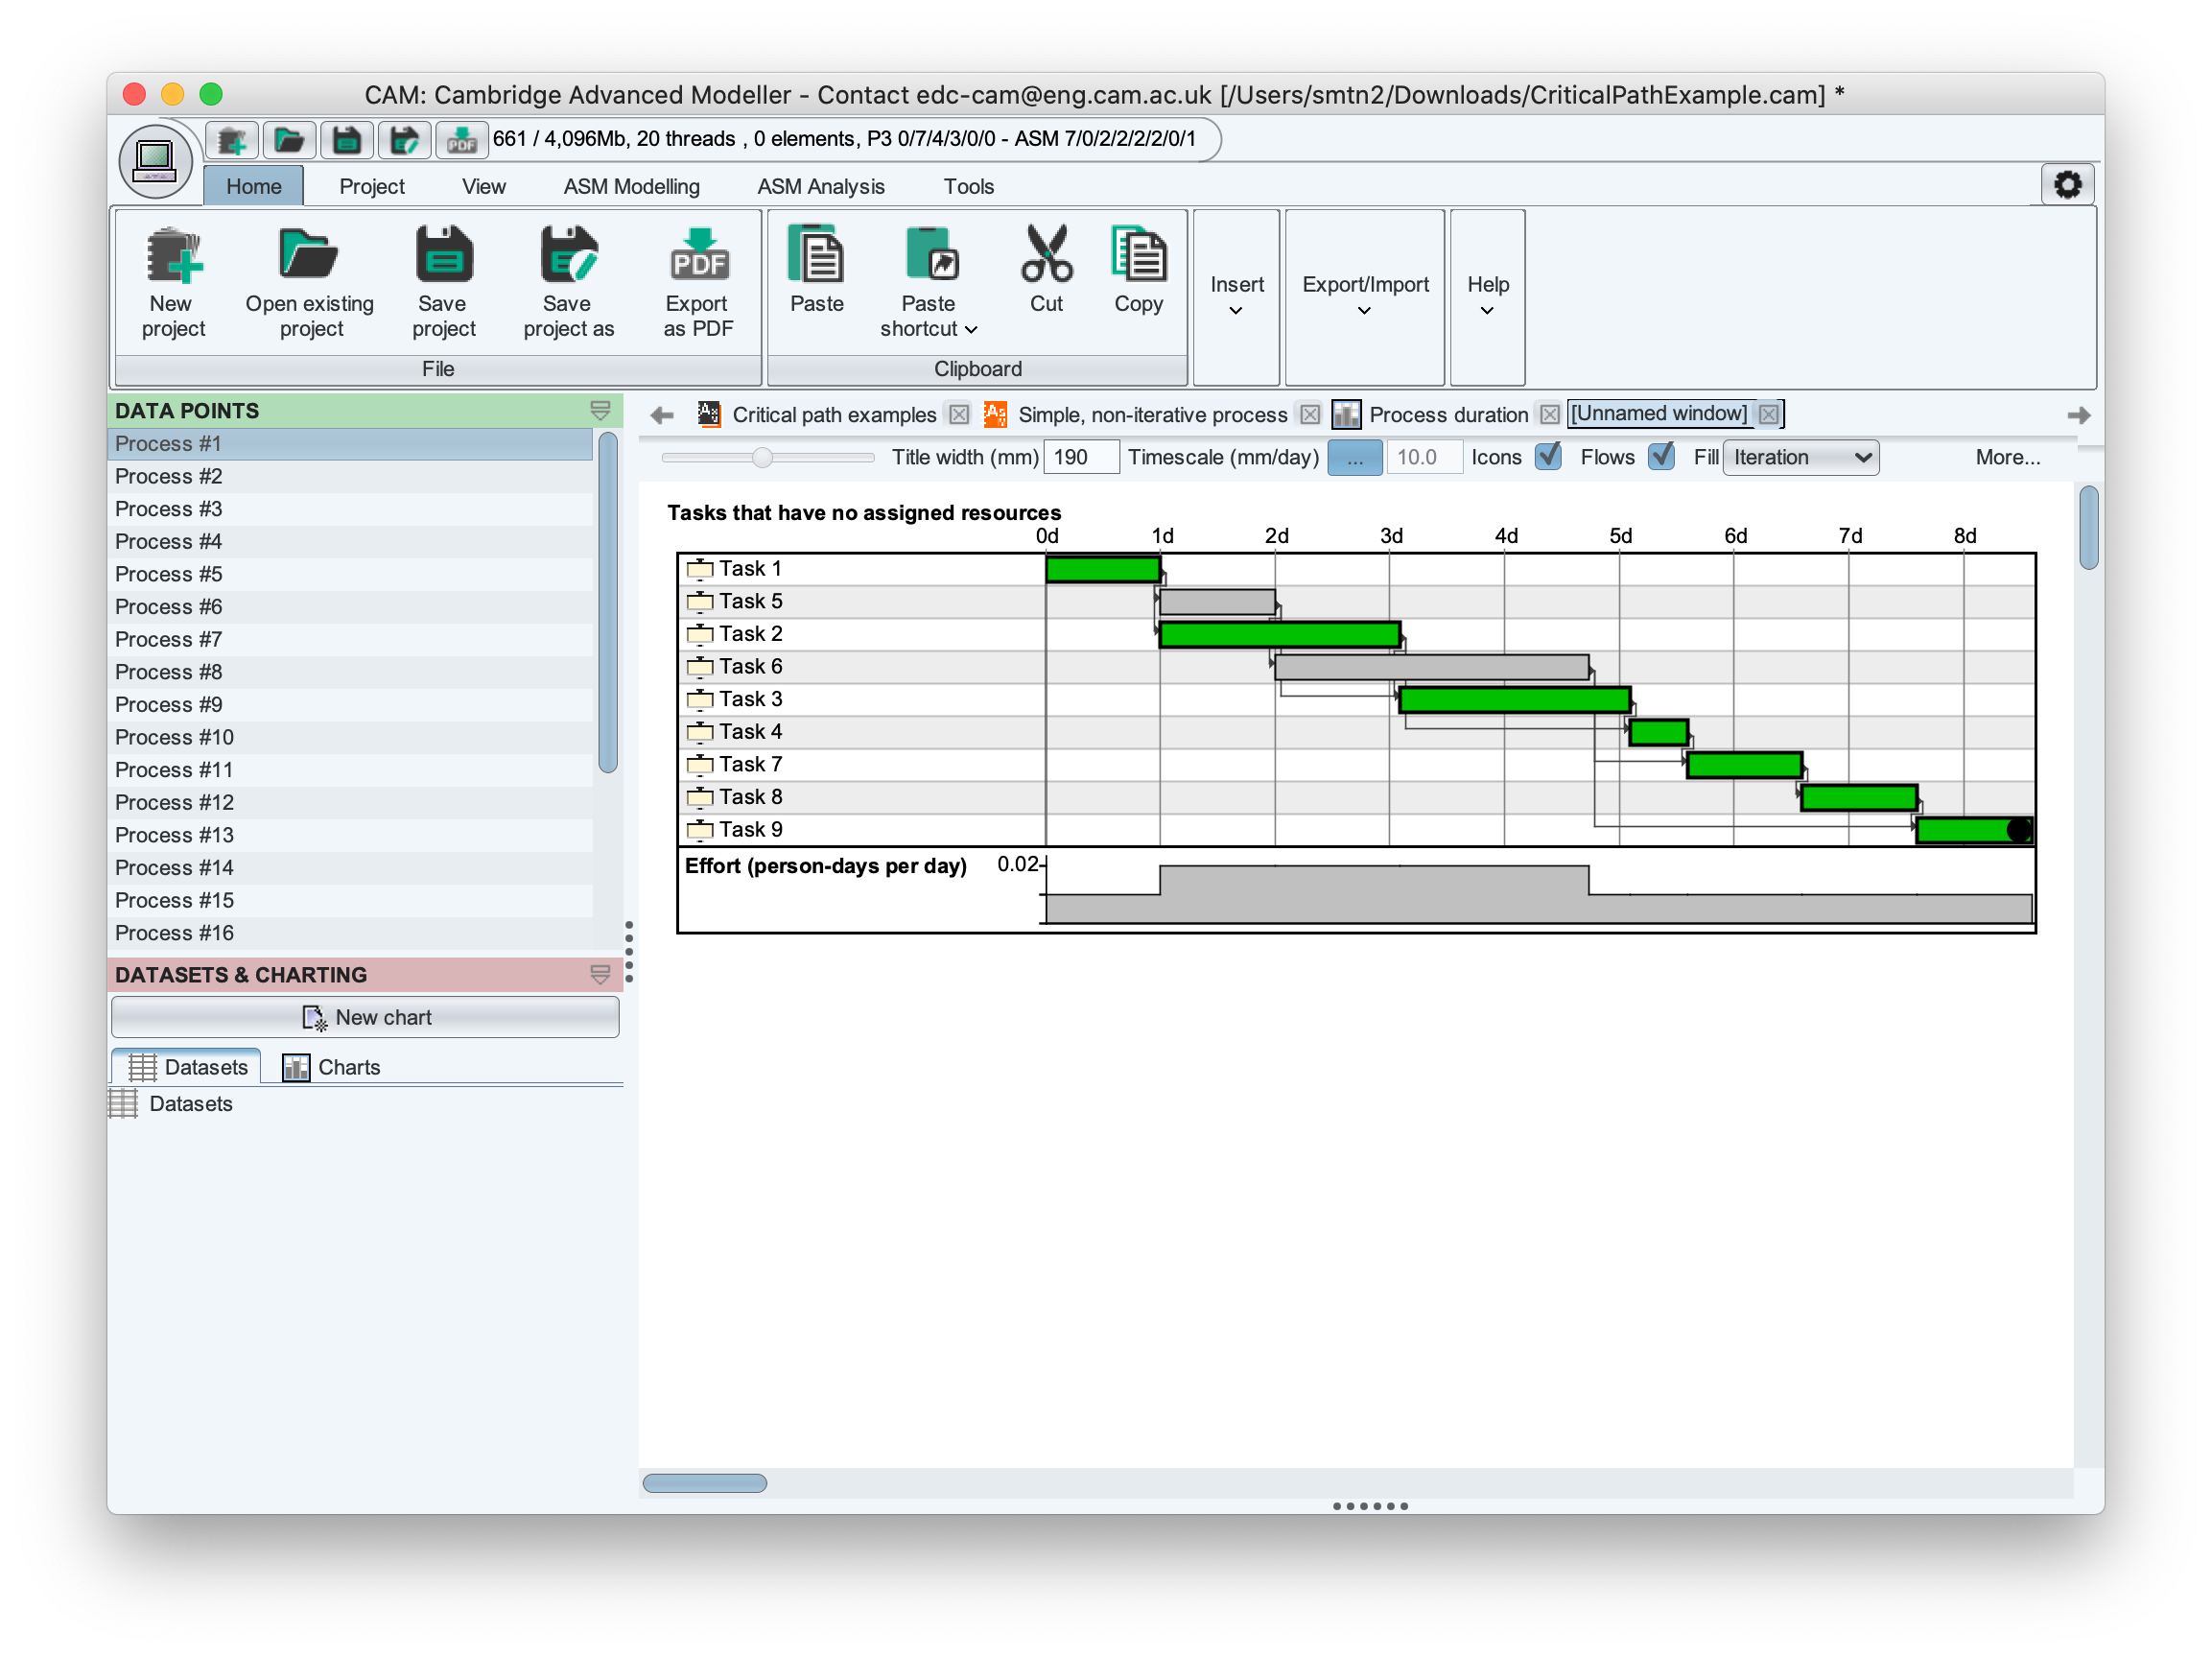
Tasks on the critical path are then highlighted automatically. In this case, tasks 5 and 6 are found to be non-critical. We can see by studying the dependencies on either the Gantt chart or process network that Task 5 feeds into 6, which then leads into 7 and 9. So, a delay to 5 or 6 in this simulation outcome will not propagate to the end of the process - because there is a 'slack' between the end of 6 and the start of 7. Of course, if the delay became greater than the slack, the two tasks would become critical!

The tendency for different tasks to become critical according to their actual durations is captured in the probabilistic nature of the model. Depending on which simulation outcome is selected, different tasks have different durations, the slack will appear in different places, and the critical path may be calculated differently. In this case, exploration of many alternatives shows that Tasks 5 and 6 are always non-critical. However in some networks, it may be helpful to think of 'degrees of criticality' - the likelihood that a task appears on the critical path. CAM does not (yet) calculate this automatically.
It can be helpful to map the critical tasks and flows between them (the critical path) back onto the diagram view of the process. This can be done manually by changing the display properties of the tasks. In the screenshot below, tasks 5 and 6 have been altered to indicate their non-critical nature. Any flows involving those tasks are also "not critical". The flow between Tasks 2 and 4 is also non-critical, because it is redundant. This redundancy has been identified by inspection and is not visible in the Gantt chart.