Overview
CAM allows process simulation results to be studied and exported as Gantt charts. Both single and probabilistic Gantt charts are supported.
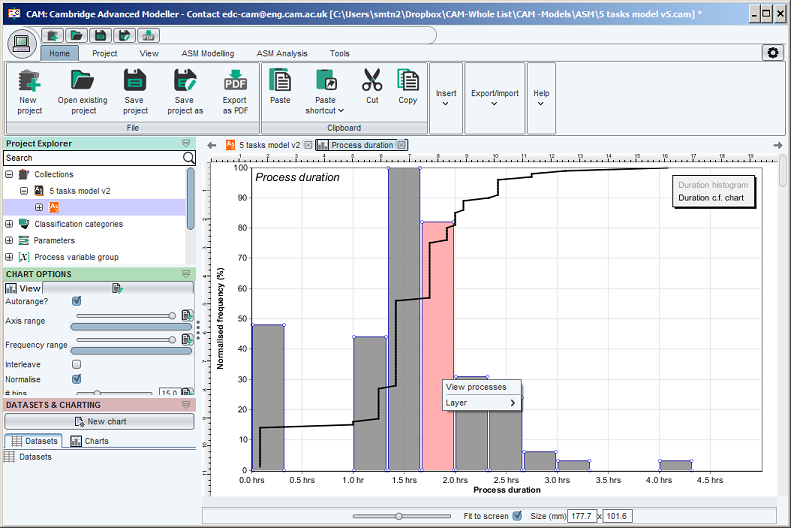
To view a process simulation results as a Gantt chart, first run a simulation, then right-click the histogram bin which contains the processes you wish to view. Then select "view processes" in the popup menu that appears.
Gantt chart of a single simulated process
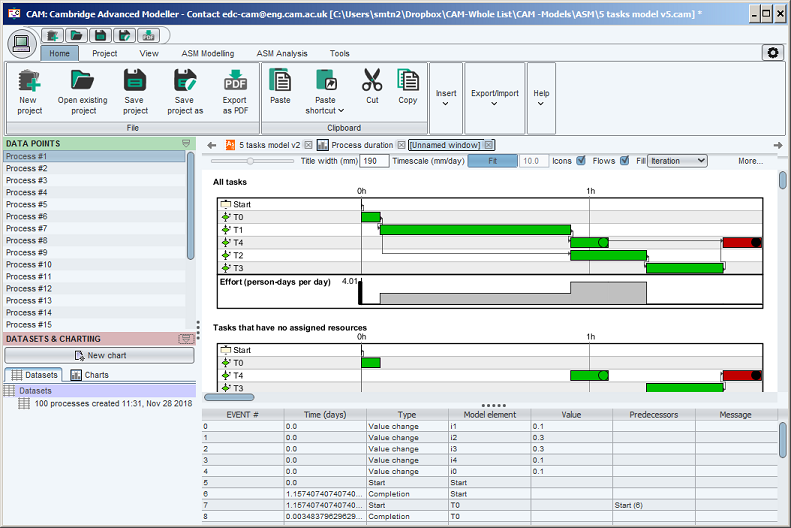
Each Gantt chart shows exactly what happened during one simulated process; different outcomes (simulation runs) may show different numbers of iterations, different task timings, etc. Thus, 100 simulation runs creates 100 unique Gantt charts that can be studied and exported.
Select the outcome you wish to view by using the list on the left-hand side of the Gantt chart display.The Gantt chart for that outcome will show tasks and dependencies as revealed through simulation.
A detailed log of events, which contains all the numeric information used to draw the Gantt chart, is shown at the bottom of the screen (you may need to grab the split pane divider and drag it "up" to view this information on a small screen). This can be exported by selecting File->Export while viewing the Gantt chart.
CAM can process the dependency structure in a Gantt chart to identify critical path and waste. To access this functionality, right-click the background area of the Gantt chart (not a bar of the Gantt chart!)
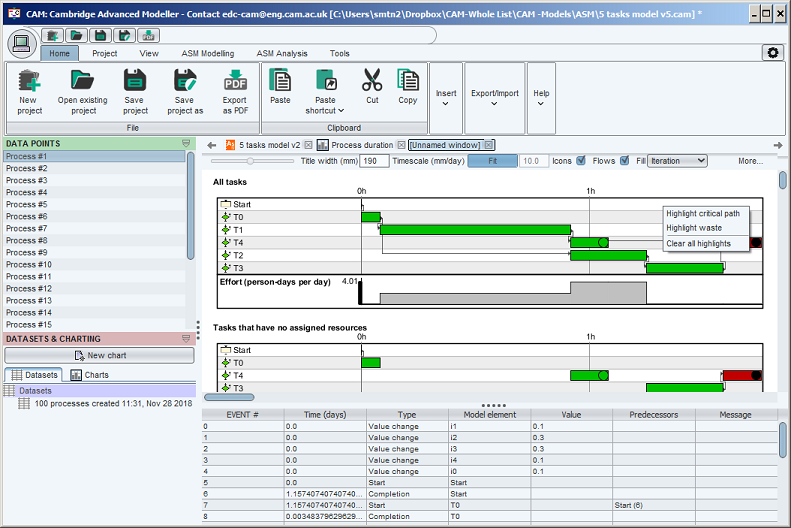
You can also highlight or unhighlight activities individually, as well as identify predecessors and successors, by right-clicking the activity of interest in the Gantt chart.
There are various options to set the scale and display of the Gantt chart.
A Gantt chart can be exported to PDF using File->Export or clicking the PDF button. This creates a vector graphic that can be converted into most formats for inclusion in articles, presentations, etc. without loss of resolution.
Probabilistic Gantt charts
Hold shift and select multiple processes to view a 'probabilistic' Gantt chart for the given selection. This is shown in the screenshot below.
The green bars show the first attempt of each task. The red bars show where a task has been revisited. The 'density' of colour shows the probability that a task will be in execution at a given time; for example, the screenshot below shows that the task executions on the far right are very unlikely to happen.
It is possible to view *all* the Gantt charts for a given simulation dataset by finding that dataset in the "Datasets and charting" tab that appears on the left of the window after running simulations, then right-clicking on that dataset for a popup and hitting "View all processes".