Using the ASM debug mode, you can work through the ASM simulation logic step-by-step to understand how the ASM process diagram will be interpreted during simulation. It is important to do this to ensure you understand the logic of the simulation.
After a few models have been created, it is usually not necessary to use the debug mode extensively - because once the logic has been understood, the models can be structured correctly for simulation while building them, and much of the debugging can be done implicitly 'by eye'.
Accessing ASM Debug mode
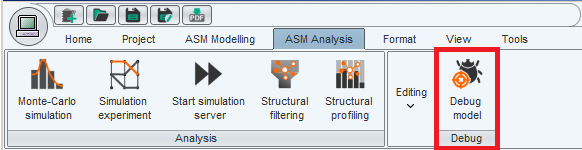
To access debug mode while viewing an ASM worksheet, select 'Debug model' button on 'Debug' band in 'ASM Analysis' tab.
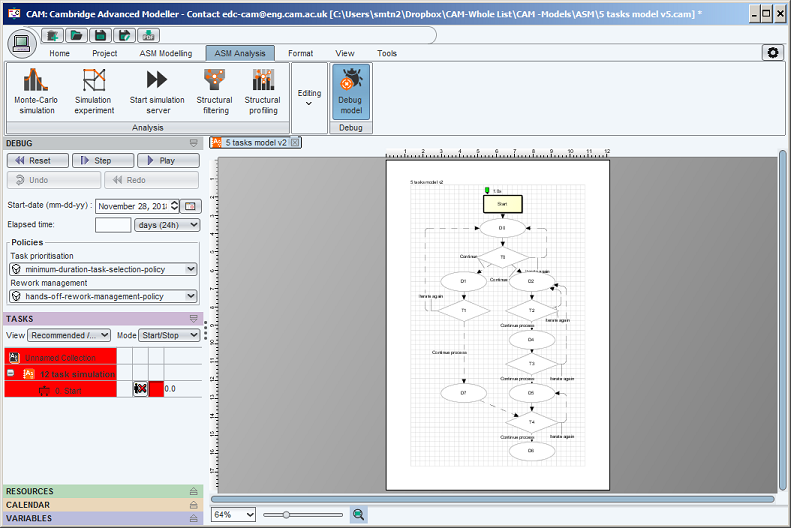
The left-hand pane of the application will change and the arrows and borders in the worksheet will also change, to show the state of the simulation network at a snapshot in time. An active debug mode is shown in the screenshot below.
When a debug session is finished, select 'Debug model' button again to return to the main ASM modelling mode for editing the model.
Note that it is necessary to return to modelling mode prior to running simulations.
Interpreting the process flow diagram in ASM debug mode
On the main diagram, every edge (arrow) has one of three states, indicated by the sort of line which is shown. In increasing 'maturity' of the information flow represented by a line:
Dashed line - the information which flows along this line has not yet been created by the last upsteam task in the flow diagram.
Heavy solid line - the information which flows along this line has been created, but has not yet been taken account of by the next downstream task. The downstream task needs to be executed for the process to move forward. The heavy solid lines thus represents the 'front' of information which is pushed through the process as activities are performed.
Solid line - the information which flows along this line has been created, and has already been taken acount of by executing the next downstream task. Therefore, the downstream task does not currently need to be executed.
On the main diagram, every task has one of three states at every step during siumulation, indicated by the sort of line shown as the task border. In increasing 'maturity' of the task execution:
Grey line (and white fill) - the task is not possible (its preconditions for execution have not yet been met)
Heavy solid line - the task is possible and recommended to begin.
Solid line - the task has been attempted before and does not currently meet its preconditions to begin again.
Stepping through the simulation
Once in debug mode, click the reset button at the top left of the sidebar to 'reset' the simulation state to its starting state.
In debug mode, by clicking once on the tasks shown in heavy solid lines (recommended to begin) you can see the effect of executing that task, in terms of creating information and possibly enabling successor tasks. It is thereby possible to trace the execution of a simulation, and to debug the preconditions and postconditions for task execution. These conditions can be changed (along with other task behaviour options) by right-clicking a task, then selecting properties in the popup menu. In the dialog which appears, click the 'Behaviour' tab located vertically along the left-hand side of the dialog. This shows a set of horizontal tabs which give many options for customising task behaviour during simulation.
When a task has multiple output scenarios, you will be asked to select the scenario which you wish to happen.
At the bottom of the left sidebar window, sub-windows for 'resources', 'calendars' and 'variables' are hidden by default. Click the arrow to the right-hand side of the hidden sub-window to track the information as debug proceeds. For instance, the 'variables' sub-window shows the value of all variables in the model, and can be used to show how they change as you step through the simulation logic.