1. Using DSM to explore the structure of components in a product
This page explains how DSM toolbox can be used to model, and analyse, the structure of interfaces between components and subsystems in a product. We focus on a cyclonic vacuum cleaner, which contains enough parts and interfaces to be worth modelling while remaining simple enough to describe relatively quickly. The vacuum cleaner modelling, on which this page is based, was led by Steffen Schmitz in Cambridge as part of his TUM Master's thesis.
The product
The specific vacuum cleaner that was modelled is shown below, with a partial disassembly of the cyclone.


Vacuum cleaner Cyclone module
The modelling process
The vacuum cleaner was disassembled in a series of workshops. First, the product was decomposed to identify the parts between which connections would be modelled. Because the modelling was originally undertaken in part to investigate the impact of looking at a product on different levels of abstraction, the parts were also grouped into subsystems in four different ways. For instance, all the parts comprising the cyclone were grouped into a cyclone module, and two sub-modules (the cyclone is an obvious module as it is removable, allowing the dust to be emptied)
The four lists of parts/subsystems formed the rows and columns in four empty DSMs, prior to eliciting the connections between parts/subsystems in each case.
To identify connections between the parts/subsystems in each DSM, small groups of students were then asked to disassemble the product, thereby identifying all the physical connections between items. Several models were separately generated on each of the four levels of abstraction. A small number of disagreements in whether connections existed or not on each level of abstraction were then identified, considered and resolved.
This generated the four DSM models shown below, which are each 'validated' in the sense that they each triangulate multiple modellers' findings.
The models
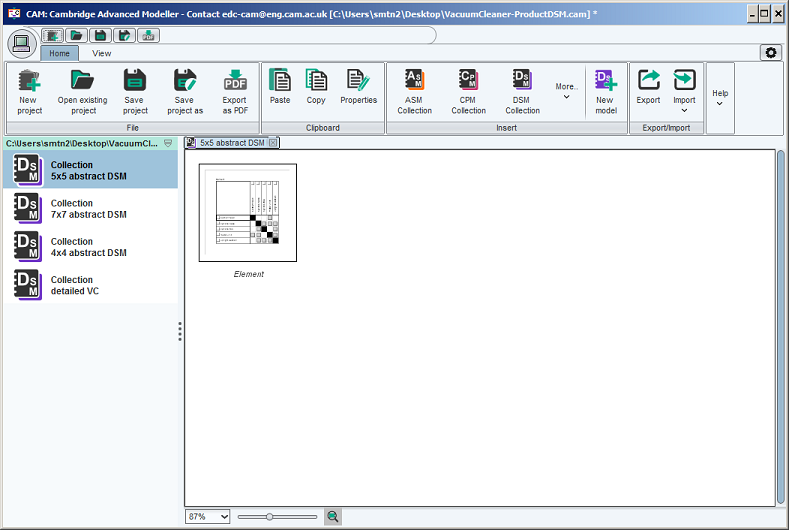
The models were created in the DSM toolbox for CAM. The workspace containing all four models can be downloaded here: VacuumCleaner-ProductDSM.cam
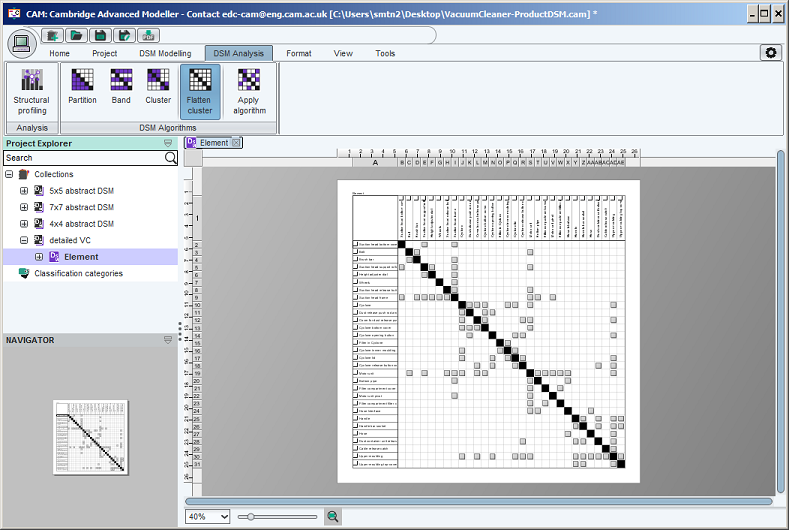
As shown in the screenshot below, the workspace contains four workbooks, representing the device at the four different levels of abstraction. The most detailed level, in which each element comprises a separate part of the product, includes groups in which the parts are clustered according to the module which they belong. For instance, one of the sub-clusters includes all parts and subsystems which comprise the cyclone module. Only physical connections between parts are represented, and these connections are always bidirectional (assuming that if A is connected to B, then B must also be connected to A)
Analysis of the model
To illustrate some of the characteristics DSM analysis can highlight, we explored this dataset using some of the features in the DSM toolbox. We focus on understanding characteristics revealed through study of the data alone.
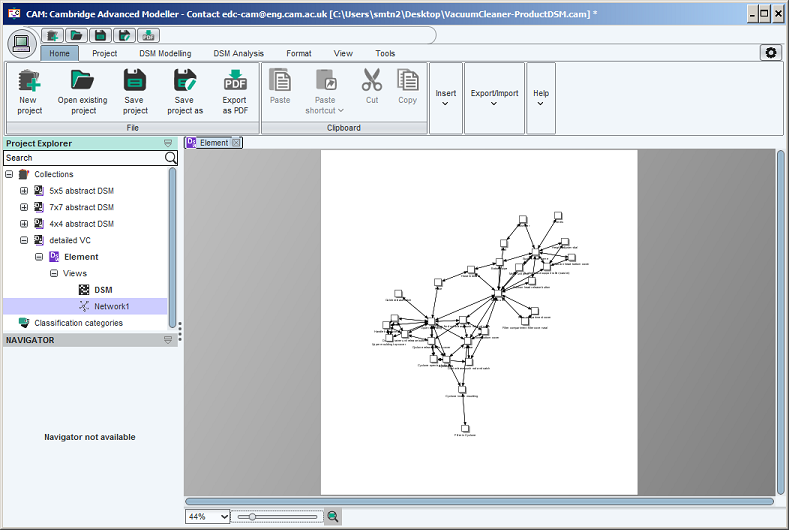
The screenshot below shows a network view, created to visualise the connectivity information in the detailed vacuum cleaner model. (Each line represents a mark in the DSM, and the clusters are not shown) The network view is hard to read, especially where there are many components and connections. Thgis can be alleviated by dragging nodes individually, then right-clicking to pin them in place (right-click a node again to unpin it).
The view highlights some 'structural characteristics' of the vacuum cleaner architecture. In particular it seems to suggest that the parts:
- upper moulding
- motor unit
- cyclone
- suction head frame
all play an important role in the product architecture. Of course, this network only shows physical connections - ie. which components are connected to which others - so another perspective of the device - eg. electrical or airflow connections - would probably give a different perspective.
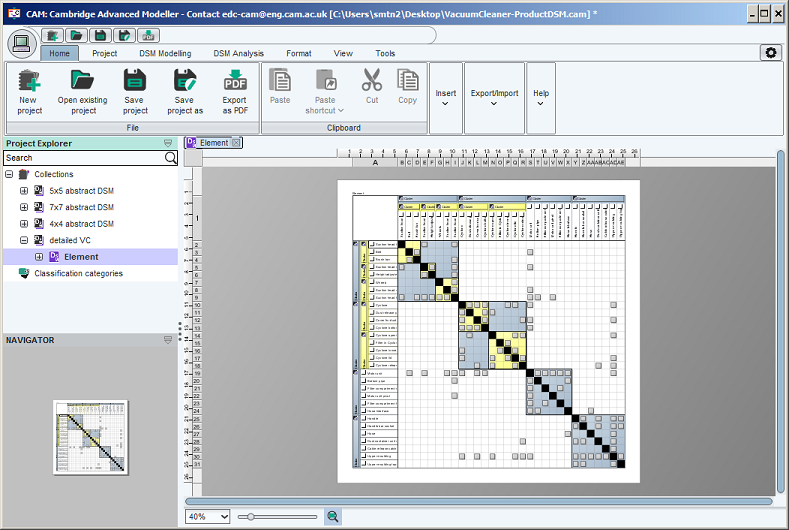
Locating these same four components in the DSM view, as shown below (click to enlarge) shows a large number of marks in the rows/columns corresponding to those four. In fact, each of these main 'structural components features in one of the main modules of the product. The physical interpretation, referring back to the pictures of the vacuum cleaner, is that these four components form the main 'spine' of the product. Other components, such as the handle, are attached to them.
Connections between pairs of components that are both within a given module are shown as marks inside each of the blue clusters in the screenshot below. Connections spanning two modules are shown in the white areas. This highlights a second characteristic - of the four key components identified in the network, only the motor unit and upper moulding have a significant connectivity to parts outside their 'main module'. This feature is clearly related to the physical layout of the product, as shown in the photos above.
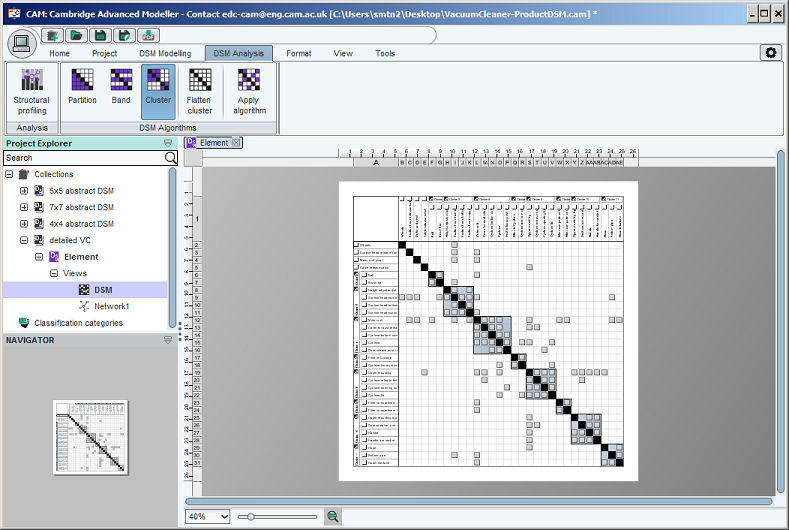
This structure of modules is based on the physical construction of the vacuum cleaner which was disassembled. After flattening all the clusters (starting with the inner clusters, right-click and select 'flatten' one-at-a-time) the DSM looks slightly different, showing only connectivity and not 'grouping':
The DSM toolbox now allows identification of alternative clusterings of the data. On the bottom toolbar, clicking the button 'cluster' applies the automatic clustering algorithm. It gives the result shown below. This seems to suggest an alternative clustering which is 'better' in the sense that there are stronger connections within modules and weaker connections across modules. This could (for instance) indicate groups of components within which design change is likely to propagate. In reality, the dependency data alone does not capture the rationale behind the original clustering; it does not explain why the components are connected in this way. A closer look at the original product underlying the data set is required to draw concrete conclusions.
Summary
This example is intended to illustrate some simple ways in which building and analysing a DSM and a force-directed (network) layout can help gain a better understanding of the architectural characteristics of a product. It shows how insight can be gained by modelling dependencies, studying structural patterns in the dependency network and relating them back to the characteristics of the physical product being analysed. This kind of analysis is relatively straightforward and non-effort-intensive to perform. It could be useful for decomposing and studying complex systems that could comprise hundreds of components/subsystems, where the modeller may not start with a good overview of how that system works.
2. Using DSM to explore the structure of communication flows in an organisation
This page explains how DSM toolbox can be used to model, and analyse, the structure of communication flows between different people in an organisation. We focus on a research laboratory, which contains enough people and different roles to be worth modelling while remaining simple enough to describe relatively quickly. The research lab being studied is the Cambridge Engineering Design Centre (EDC). The modelling, on which this page is based, was led by Steffen Schmitz as part of his Master's thesis.
The organisation
At the time of modelling, the EDC comprised 48 researchers divided into seven themes. Each theme represents a different topic area and range in size from one researcher to 14. The researchers hold different job titles: MPhil student; PhD student; Research Associate (RA); Senior Research Associate (SRA). Professors, Lecturers etc were not included in the analysis.
The modelling process
An online questionnaire was created and sent to each researcher. Each researcher was asked to select, for the 47 other researchers, the 'Intensity' and 'Frequency' of work-related communication between themselves and that individual. Frequency could be selected from: Daily Weekly Monthly Rarely/Never. Intensity could be selected from High, Medium, or Low.
4 SRAs, presumed to have a good overview of communication in the group due to their more central roles as senior members, were asked to independently fill out marks in a 7x7 matrix, considering the frequency and intensity of interactions across research themes in the EDC.
The models
The results were anonymised and then compiled into two 48x48 DSMs and four 7x7 DSMs. The first 48x48 DSM includes only dependencies between individuals if those people spoke at least weekly and with at least medium intensity according to the survey results. The second 48x48 DSM contains all interactions identified through the survey, regardless of frequency and intensity. Both these large matrices are clustered, putting the researchers into the themes in which they belong. Where a researcher worked across two or more themes, their 'strongest affiliation' was used to create the clustering. The affiliation did not affect the connections between researchers in the matrices.
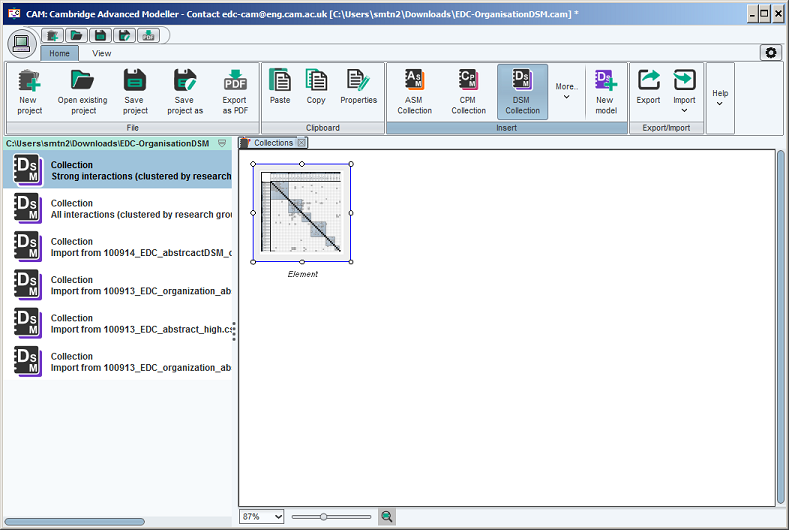
The models were created in the DSM toolbox for CAM. The workspace containing all the models can be downloaded here: EDC-OrganisationDSM.cam
For an example of how this kind of model can be analysed, refer to the product model above; the same principles apply!