After running CPM Analysis, use icons in the 'Plots' ribbon on the 'CPM Analysis' tab to analyse change propagation and generate the following diagrams:
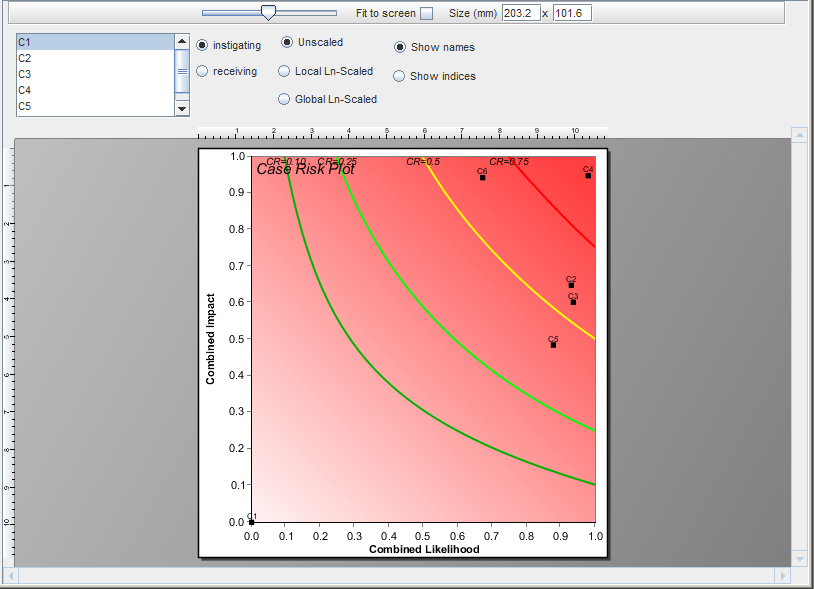
- Case Risk Plot depicts for a selected change instigating (or receiving) component all affected (or causative) components in a square diagram with combined impact on its vertical axis and combined likelihood on its horizontal axis. The diagram axis can be logarithmic scaled using the corresponding column (or row) of the combined risk matrix (Local Ln-Scaled) or using the whole combined risk matrix (Global Ln-Scaled).
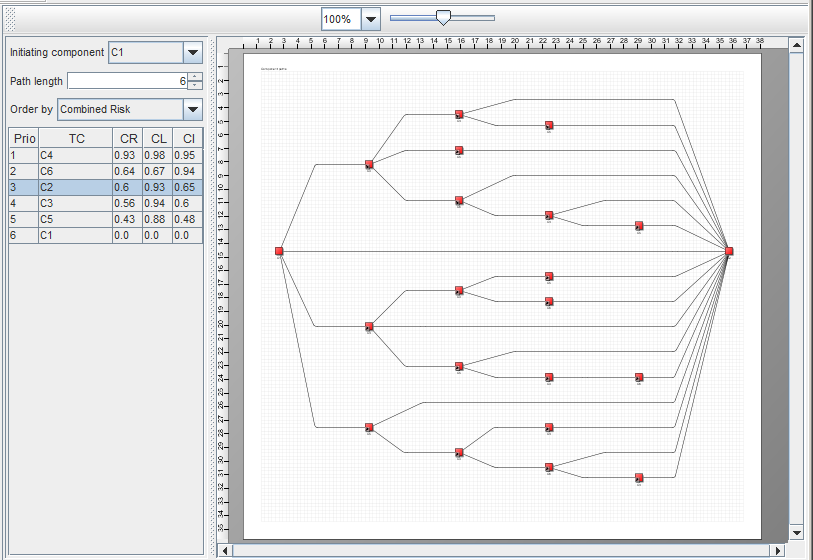
- Change Propagation Path Diagram depicts for a selected change initiating component all possible change propagation paths of a selected length to a selected target component (TC).
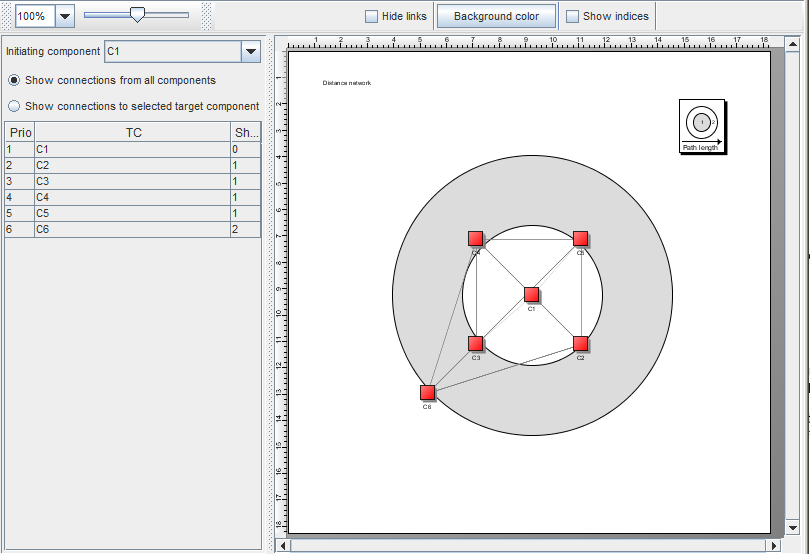
- Distance Network depicts for a selected change initiating component (represented in the centre of the inner circle) the shortest path length to each affected target component (represented on the circle borders of different order).
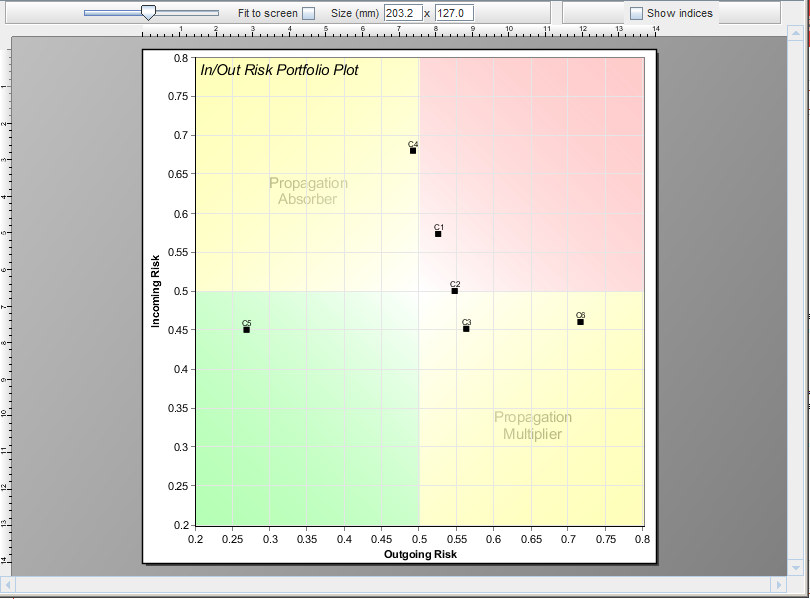
- In/Out Risk Portfolio Plot depicts all components in a square diagram with incoming risk (row average of the combined risk matrix) on its vertical axis and outgoing risk (column average of the combined risk matrix) on its horizontal axis. This allows differentiating between change propagation absorbers and multipliers.
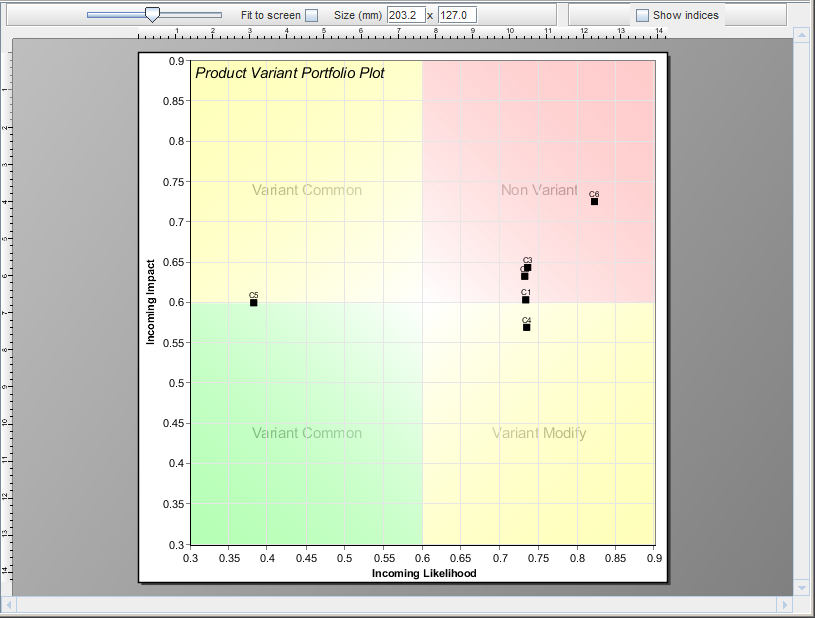
- Product Variant Portfolio Plot depicts all components in a square diagram with incoming impact (row average of the combined impact matrix) on its vertical axis and incoming likelihood (row average of the combined likelihood matrix) on its horizontal axis. This allows differentiating between types of variants.
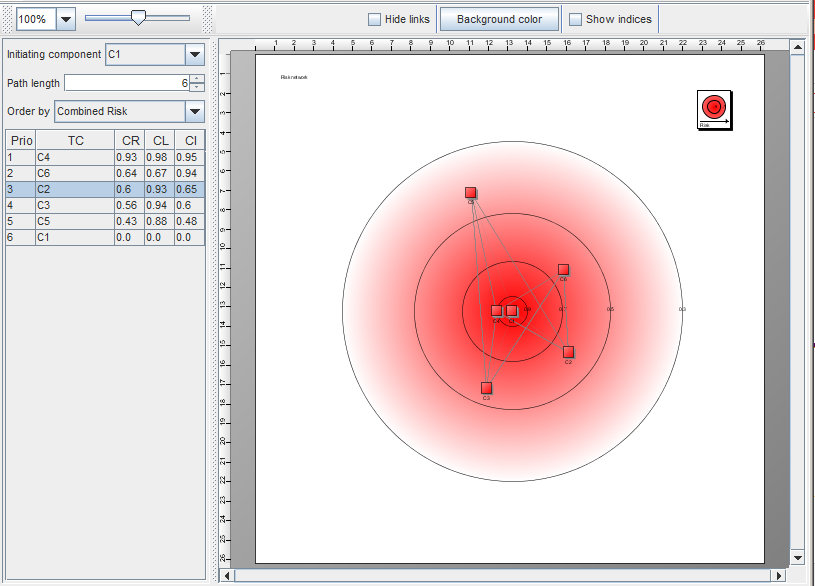
- Risk Network depicts for a selected change initiating component (represented in the centre of the inner circle) the imposed combined risk values of a selected path length to each affected target component (represented within the outer circles of decreasing values). The distance of the components to the central component corresponds to their reciprocal combined risk values.