It is possible to create multiple views for a model in CAM. The standard views supported in CAM are 'Diagram', 'DSM' and 'Network'. (Customised views can also be created for a toolbox by adding files in a specific template into the toolbox directory.)
How to create views
There are different ways you can create views.
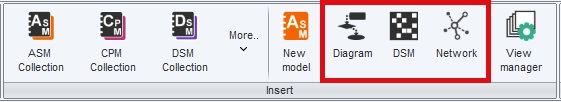
a) Standard views can be created by clicking on ‘Diagram’, ’DSM’, ’Network’ buttons in the ‘Insert’ band on the ‘Home’ tab.
This will create a dialog. Then,
- Enter a name for the view you wish to create.
- Click OK.
- The new view will be displayed.
OR
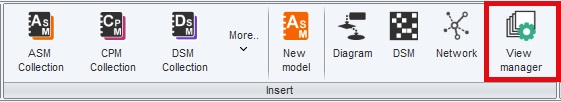
b) Alternatively click the ‘View Manager’ button.
This will create a dialog. Then,
- Click 'New' button.
- Enter a name for the view and select the type of the view you wish to create (eg. Network, for a force-directed layout).
- Click OK. The new view will be displayed.
OR
c) Right-click the model node on the project explorer tree on left pane in the model view. Select ‘Insert view’ in the pop-up menu.
How to switch between views
The views created will be displayed under the node 'Views' within the corresponding model node in the project explorer tree displayed in the left pane. Double click the required view node to display the view.
The default types of views which are available are described below.
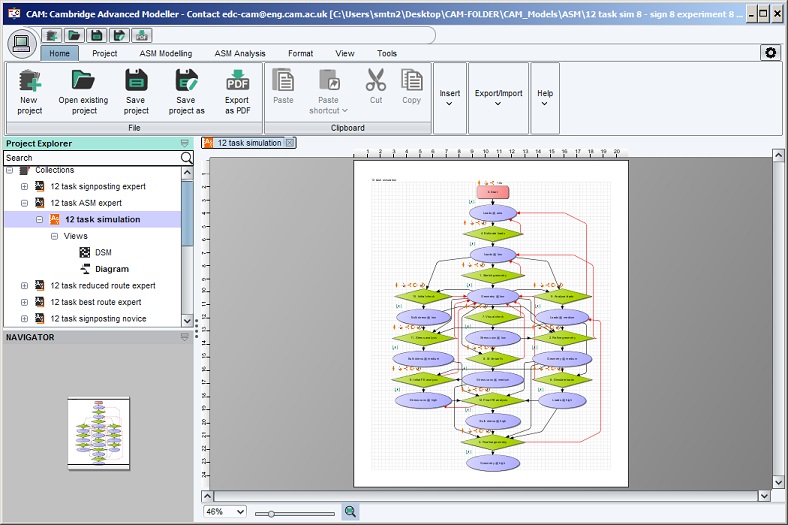
1. Diagram views
Diagram views are the basic view for toolboxes such as the ASM. They allow models to be drawn using a simple interface, shown in the screenshot below. This interface is designed to be similar to general-purpose diagramming packages.
Features include:
- Expandable worksheets: In CAM, it is easy to progressively create very large diagrams, expanding the worksheet as new nodes are added anywhere on the diagram. Use the gridline tools in the ‘Grid’ band on the ‘ASM Modelling’ tab to add or remove gridlines anywhere on the worksheet.
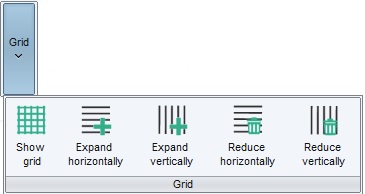
- Decompose a diagram into sub-sheets: Each model (ie. sheet of paper on which the diagram is drawn) can be decomposed into sub-models. Sub-models can be opened and closed by double-clicking, to show or hide detail. Using the ‘Sub-model in new window’ button (in the ‘Show’ band in ‘View’ ribbon), you can choose between opening each sub-process on a new sheet (with inputs and outputs crossing the boundary) or 'stretching' the space on the existing sheet to make room for it. For instance, to create more space horizontally, select the ‘Expand horizontally' button, click and hold in the location where you want to create the extra gridlines, then drag the mouse to the right to specify how much additional space you require.When the mouse is released, the additional gridlines will be created in the specified location. This allows a worksheet to be easily expanded to create space for more diagram nodes, or compacted to save space.
![]()
- Decompose a diagram across multiple models: It is also possible to create multiple models in a diagram collection. These can be conceptualised as splitting a model into multiple 'slides'. Nodes on different models can be linked using the hyperlink tool as described below.
- Split edges using hyperlinks: Bi-directional hyperlinks allow nodes on a diagram to be joined to other nodes without creating an edge between them. The hyperlinks are shown on the diagram as small circles. Double-clicking one of these endpoints will cause the display to 'jump' to the other end. Hyperlinks can split an edge within a model, across sub-sheets, across models, or across collections. Hyperlinks are specific to the diagram view on which they are drawn.
- Use node shortcuts to reduce the complexity of diagrams: Shortcuts can be created to a node on a diagram; this allows the item to be used in multiple places in the model (exactly like a shortcut in a file system). The shortcuts represent the same item as the original, but they can be connected independently in different parts of the diagram. This is another way to reduce the apparent complexity of a diagram while maintaining the underlying connectivity between elements in the model.
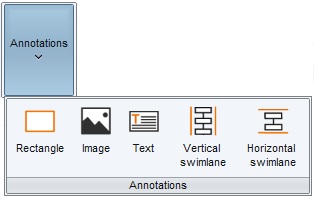
- Add mark-up: Simple mark-up (rectangles, text boxes, swimlanes and images) can be used to add information to a model drawn on a diagram view using tools in the “Annotations’ band on the ‘ASM Modelling’ tab.
- Use automatic layouts: Some simple automatic layout algorithms can help visualise the structure of dependency data, which can be useful as a starting point to improving the layout manually (for fully-automatic layouts, see the network view below)
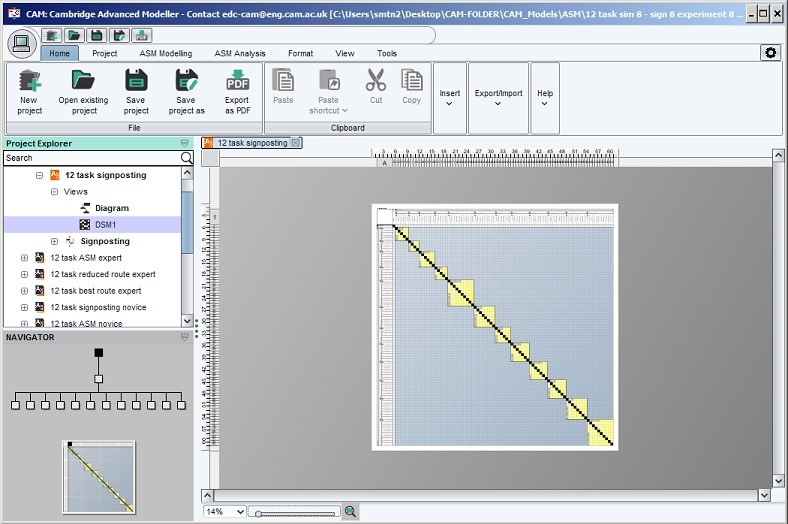
2. DSM views
DSM (dependency structure matrix) views provide a compact way of visualising dependency data and discovering structural characteristics. A specific DSM toolbox is available, but the same functionality can be accessed for any model by creating a DSM view as explained above.
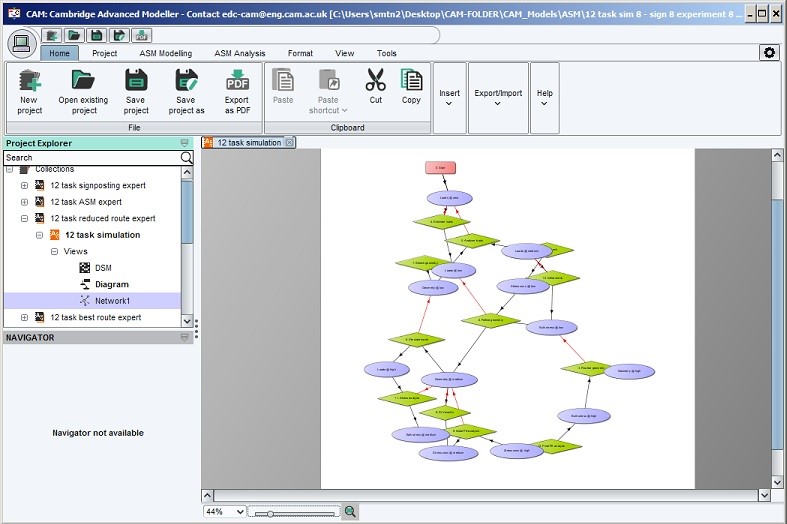
3. Network views
Network views use a force-directed layout to visualise the connections between model elements. An example is shown in the screenshot below.
Network views do not allow the user to provide additional mark-up on a diagram. They also do not (for the moment) allow model data to be modified directly.
However, since they do not require manual layout, they can be useful for highlighting dependency structures in strongly-connected models, for instance, created using the DSM toolbox.
To lock elements in position (ie. pin them to the worksheet) on a network view, right-click the element. Right-click an already-locked element to unlock it. This can be useful for teasing out the structure of dependencies, especially in cases where the force-directed layout wants to put many nodes on top of each other.