Overview
Parallel coordinate charts are a way to visualise and compare a set of datapoints defined in multiple dimensions. In CAM, they are particularly useful to understand simulation results which are described by more than 2 values - for instance, you might wish to view a set of processes in terms of duration, cost, duration variability and cost variability, all on one chart. They provide similar functionality to the XY plot and XYZ plot, but allow an arbitrary number of axes to be created.
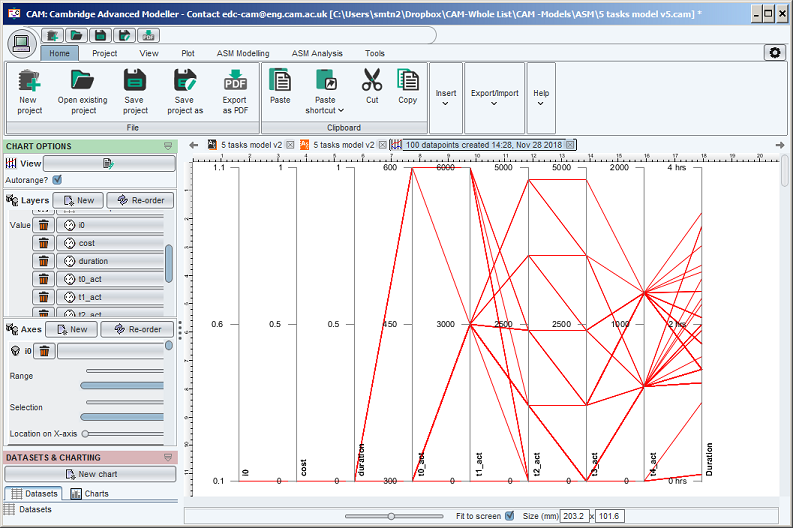
An example of a parallel coordinate plot, showing three axes, is shown in the first screenshot below. Each line on this plot represents one task in a process, and joins one point on each of the axes. In other words, each task is shown as a line comprising two connected 'segments' running from the datapoint representing that task on the left-hand axis, through the datapoint on the central axis, and terminating on the datapoint representing the task on the right-hand axis. For comparison, the same data and axes are shown in the XYZ point cloud, in the second screenshot below.
Uses of the plot
This plot is useful for:
- Visualising datapoints on a large number of dimensions. The plot shown below shows only 3 dimensions; but a large number can be efficiently visualised. In comparison, an XY plot shows only 2 dimensions, and an XYZ point cloud shows three (but is difficult to comprehend unless it can be manipulated interactively, on a screen)
- Selecting datapoints. It is easy to visually identify datapoints which have high values of all three metrics, which have low values of all three metrics, and which have a combination of values.This can be useful if the metrics represent performance - eg. of all the process runs resulting from a simulation, which of these satisfy cost, duration and milestone constraints? (for an application of selection to support project planning, see here)
- Identifying correlations. The plot is useful to identify when metrics are correlated, eg when a high value of an independent variable implies a high value of a dependent variable. In the case shown below it is clear that the metrics on the 1st and 2nd axes are correlated, since most lines do not cross between the first two axis.There is no such correlation between the 2nd and 3rd axis. Reordering the axes would highlight possible correlations between other axis pairs
Using the parallel coordinate chart in CAM
First, you must create a new chart of type 'Parallel coordinates', by clicking the New chart button on the Datasets and charting pane, to the left hand side of the window. (this pane appears after running a simulation).
After creating a chart, a blank window will appear. You must use the Layers and Axes panes appearing in the Chart Options pane at the top left of teh chart window, as visible above, to configure both the axes you wish to see and the datasets you wish to plot on these axes:
- Defining axes. The number of (and titles and ranges of) axes are defined for the chart using the "Axes" Panel.
- Defining layers. The layers are then defined as normal using the 'Values' panel. The Values chosen will be plotted in sequence on the axes. (The number of axes takes priority - so if you have 3 axes, if a given layer only has 2 Values then it won't have anything plotted on the 3rd axis, while if it has 4 Values the 4th will be ignored.)
For instance, if you want a plot of ASM process simulation results, showing each process run in terms of the three values: process duration, final value of a process variable, and resource usage (for instance):
- Run the ASM simulation
- Create a new chart of type'Parallel co-ordinates'
- Create 3 axes for the chart and label them according to the 3 values you wish to plot, in the order you want to plot them
- Create a single layer with the appropriate colour and the simulation dataset
- Create 3 values within the layer with the appropriate Values, specified in the order you want to plot them.
You can use the range controls to set the range on each of the three axes, independently. You can also add additional layers to the chart (for most applications, each of the layers should use the same values in the same order - and differ only in the dataset which is plotted)